| The North Atlantic hurricane season officially runs from 1 June to 30 November. The vast majority of tropical storms and hurricanes are typically seen during August-October (ASO), the peak months of the hurricane season.
Hurricane season averages and classifications for overall activity are based on data from the 30-year period 1981-2010. This shorter base period is used (rather than the longer 1950-2010 period) because it is more accurate and better represents our ability to identify relatively weak, short-lived systems that went unnoticed earlier in the record (Landsea et al. 2010).
During 1981-2010, Atlantic hurricane seasons averaged 12.1 named storms (NS, maximum 1-minute sustained 10 m wind speeds between 39-73 mph), with 6.4 of those becoming hurricanes (H, maximum 1-minute sustained 10 m wind speeds of at least 74 mph) and 2.7 becoming major hurricanes (MH, maximum 1-minute sustained 10 m wind speeds exceeding 111 mph, categories 3-5 on the Saffir-Simpson hurricane scale).
Measuring total overall seasonal activity: The Accumulated Cyclone Energy (ACE) index
The phrase "total overall seasonal activity" refers to the combined intensity and duration of Atlantic named storms and hurricanes occurring during the season. The measure of total seasonal activity used by NOAA is the Accumulated Cyclone Energy (ACE) index. The ACE index is a wind energy index, defined as the sum of the squares of the maximum sustained surface wind speed (knots) measured every six hours for all named storms while they are at least tropical storm intensity.
The 1981-2010 mean value of the ACE index is 105.6 x 10⁴ kt2, and the median value is 92.4 x 10⁴ kt2. The following classifications are based on an approximate tercile partitioning of seasons based on the ACE index, combined with the seasonal number of tropical storms, hurricanes and major hurricanes.
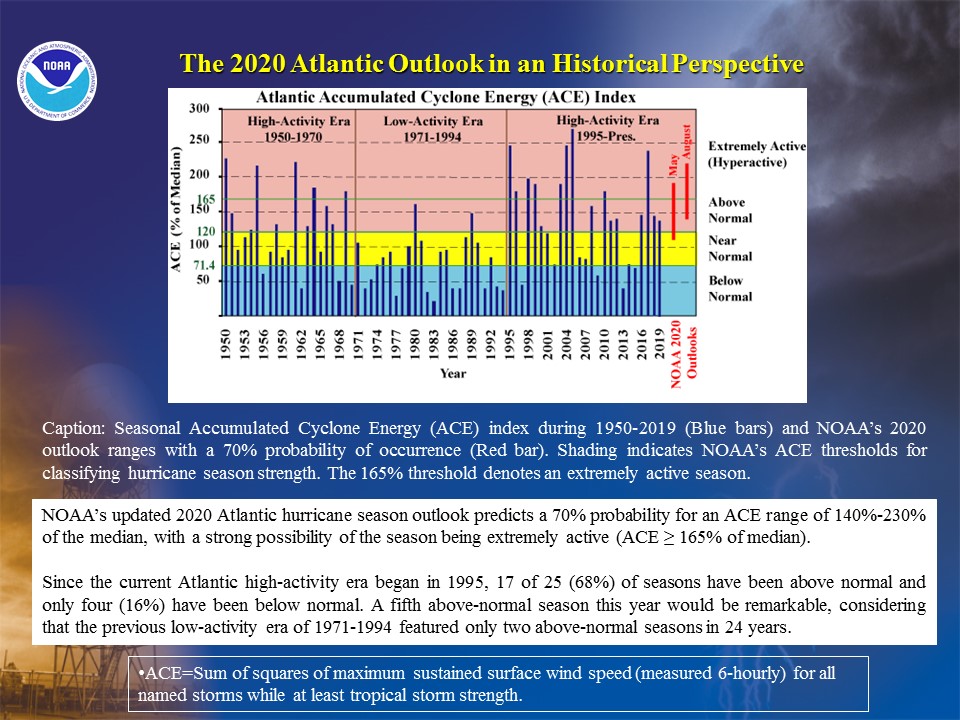
Extremely active season: An ACE index above 152.5 x 10⁴ kt2 (corresponding to 165% of the 1981-2010 median).
Above-normal season: An ACE index above 111 x 104 kt2 (corresponding to 120% of the 1981-2010 median), with at least two of the following three conditions: 13 or more named storms, 7 or more hurricanes, and 3 or more major hurricanes.
Below-normal season:
a) An ACE index below 66 x 104 kt2 (corresponding to less than 71.4% of the 1981-2010 median), or b) An ACE index above 71.4% of the median with the following three conditions: 9 or fewer named storms, 4 or fewer hurricanes, 1 or fewer major hurricanes.
Near-normal season: Neither the above- nor below-normal season criteria are met.
A near-normal season will typically have an ACE range of 66-111 x 104 kt2 (corresponding to 71.4%-120% of the 1981-2010 median).
| Season Type |
Mean |
Range of Named storms |
Mean |
Range of Hurricanes |
Mean |
Range of Major Hurricanes |
| Above-Normal |
16.5 |
12 to 28 |
9.7 |
7 to 15 |
4.8 |
3 to 7 |
| Near-Normal |
12.3 |
10-15 |
6.3 |
4 to 9 |
2.3 |
1 to 4 |
| Below-Normal |
6.7 |
4 to 9 |
3.3 |
2 to 4 |
1.0 |
0 to 2 |
| All Seasons |
12.1 |
4 to 28 |
6.4 |
2 to 15 |
2.7 |
0 to 7 |
|


