This 2020 Atlantic hurricane season outlook is an official product of the National Oceanic and Atmospheric Administration (NOAA) Climate Prediction Center (CPC). The outlook is produced in collaboration with hurricane experts from the National Hurricane Center (NHC) and the Hurricane Research Division (HRD). The Atlantic hurricane region includes the North Atlantic Ocean, Caribbean Sea, and Gulf of Mexico.
Interpretation of NOAA's Atlantic hurricane season outlook:
This outlook is a general guide to the expected overall activity during the hurricane season. It is not a seasonal hurricane landfall forecast, and it does not predict levels of activity for any particular location. Preparedness:
Hurricane-related disasters can occur whether the season is active or relatively quiet. It only takes one hurricane (or tropical storm) to cause a disaster. It is crucial that residents, businesses, and government agencies of coastal and near-coastal regions prepare for every hurricane season regardless of this, or any other, seasonal outlook. The Federal Emergency Management Agency (FEMA), the NHC, the Small Business Administration, and the American Red Cross all provide important hurricane preparedness information on their web sites.
NOAA does not make seasonal hurricane landfall predictions:
NOAA does not make seasonal hurricane landfall predictions. Hurricane landfalls are largely determined by the weather patterns in place as the hurricane approaches, which are predictable when the storm is within several days of making landfall.
Nature of this Outlook and the "likely" ranges of activity:
This outlook is probabilistic, meaning the stated "likely" ranges of activity have a certain likelihood of occurring. The seasonal activity is expected to fall within these ranges in 7 out of 10 seasons with similar climate conditions and uncertainties to those expected this year. The ranges do not represent the total possible activity seen in past similar years.
This outlook is based on 1) predictions of large-scale climate factors known to influence seasonal hurricane activity, and 2) climate models that directly predict seasonal hurricane activity.
Sources of uncertainty in the seasonal outlooks:
- Predicting El Niño and La Niña (also called the El Niño-Southern Oscillation, or ENSO) and their impacts is an ongoing scientific challenge facing climate scientists today. Such forecasts made during the spring generally have limited skill.
- Many combinations of named storms and hurricanes can occur for the same general set of climate conditions. For example, one cannot know with certainty whether a given climate signal will be associated with several shorter-lived storms or fewer longer-lived storms with greater intensity.
- Model predictions of sea surface temperatures (SSTs), vertical wind shear, moisture, atmospheric stability, and other factors known to influence overall seasonal hurricane activity have limited skill this far in advance of the peak months (August-October) of the hurricane season.
- Weather patterns that are unpredictable on seasonal time scales can sometimes develop and last for weeks or months, possibly affecting seasonal hurricane activity.
2020 Atlantic Hurricane Season Outlook Summary
a. Predicted Activity
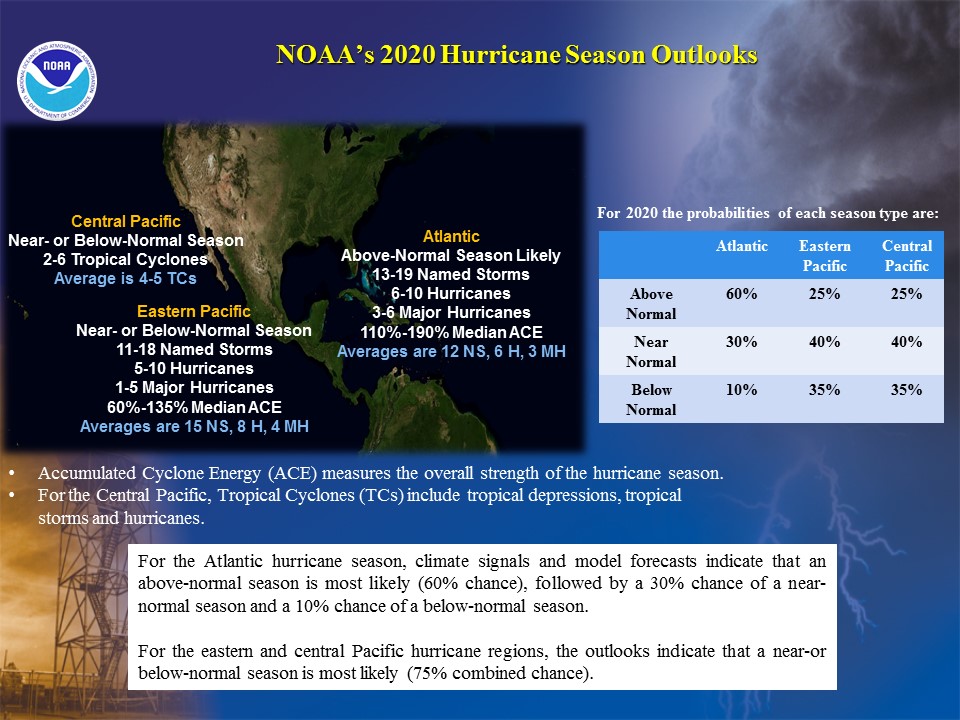
NOAA’s outlook for the 2020 Atlantic Hurricane Season indicates that an above-normal season is most likely. The outlook calls for a 60% chance of an above-normal season, followed by a 30% chance of a near-normal season and a 10% chance of a below-normal season. See NOAA definitions of above-, near-, and below-normal seasons. The Atlantic hurricane region includes the North Atlantic Ocean, Caribbean Sea, and Gulf of Mexico.
The 2020 outlook calls for a 70% probability for each of the following ranges of activity:
- 13-19 Named Storms
- 6-10 Hurricanes
- 3-6 Major Hurricanes
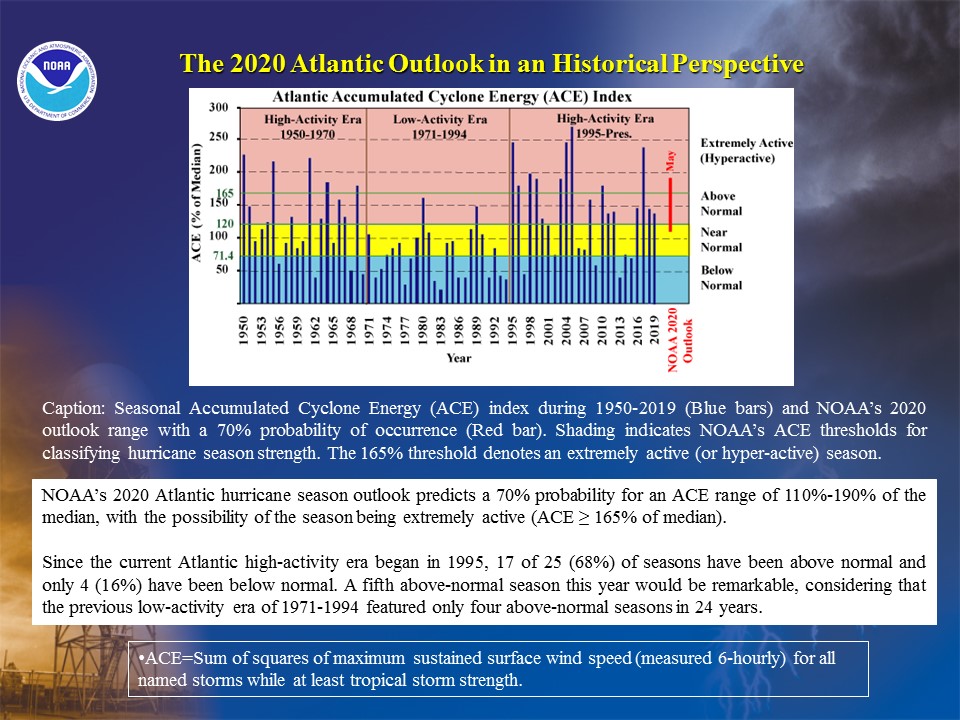
- Accumulated Cyclone Energy (ACE) range of 110%-190% of the median
The seasonal activity is expected to fall within these ranges in 70% of seasons with similar climate conditions and uncertainties to those expected this year. These ranges do not represent the total possible ranges of activity seen in past similar years. The predicted ranges for 2020 are centered above the 1981-2010 seasonal averages of 12 named storms, 6 hurricanes, and 3 major hurricanes. Most of the predicted activity is likely to occur during the peak months (August-October, ASO) of the hurricane season.
The Atlantic hurricane season officially runs from June 1st through November 30th. This outlook will be updated in early August to coincide with the onset of the peak months of the season.
b. Reasoning behind the outlook
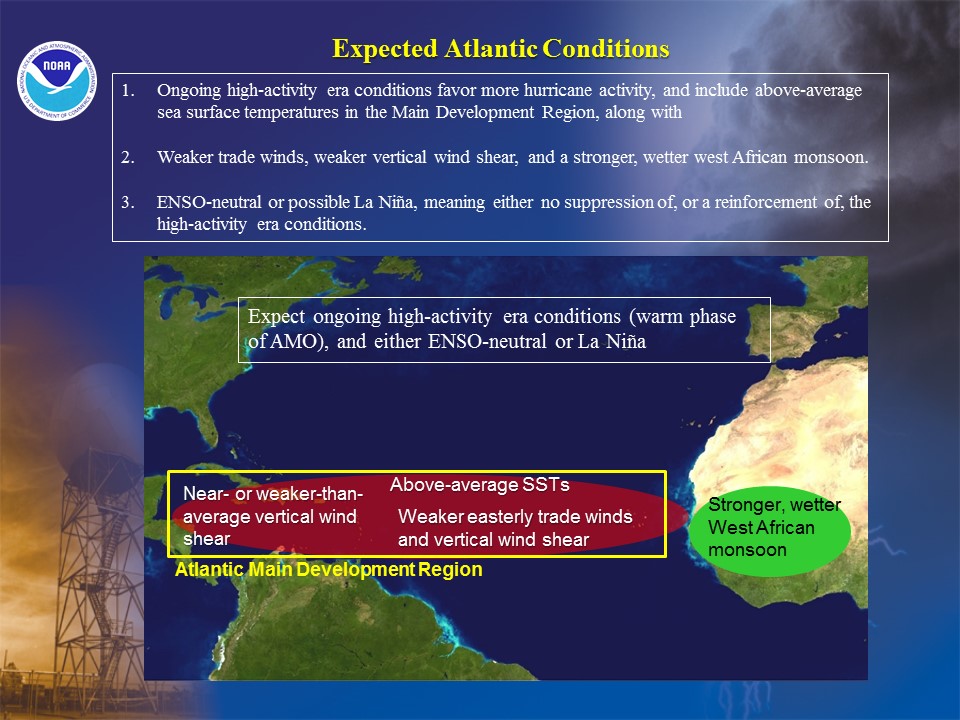
This 2020 seasonal hurricane outlook reflects two main climate factors during August-October which which historically tend to produce above-normal Atlantic hurricane seasons. These are:
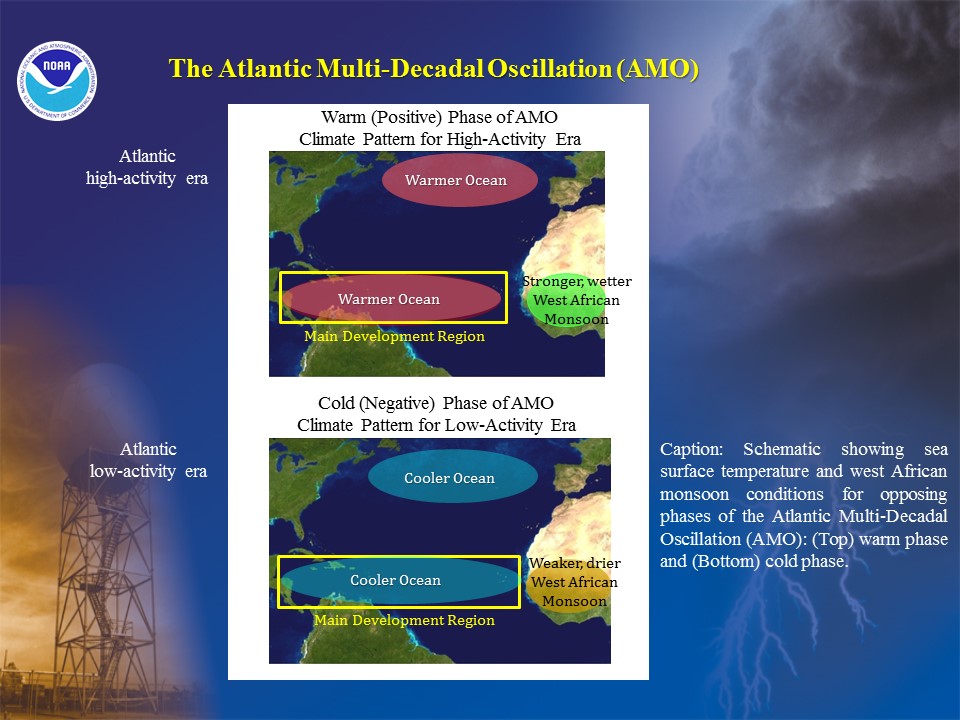
1) The set of conditions that have produced the ongoing high-activity era for Atlantic hurricanes that began in 1995. These conditions include warmer sea surface temperatures (SSTs) and weaker trade winds in the Atlantic hurricane Main Development Region (MDR), along with weaker vertical wind shear and an enhanced West African monsoon. The MDR spans the tropical Atlantic Ocean and Caribbean Sea (Goldenberg and Shapiro 1996).
2) The most recent forecast from the NOAA Climate Prediction Center indicates a likely continuation of ENSO-neutral conditions (i.e., no El Niño or La Niña), or even the development of La Niña. ENSO-neutral does not inhibit tropical storm or hurricane formation, nor does it suppress the high-activity era conditions. If La Niña develops, it would reinforce the high-activity era conditions, and further increase the likelihood of an above-normal season with activity near the upper ends of the predicted ranges.
Preparedness for Tropical Storm and Hurricane Landfalls:
It is important to remember that it only takes one storm hitting an area to cause a disaster, regardless of the overall activity for the season. Therefore, residents, businesses, and government agencies of coastal and near-coastal regions are urged to prepare every hurricane season regardless of this, or any other, seasonal outlook.
DISCUSSION
1. Expected 2020 activity
NOAA’s outlook for the 2020 Atlantic Hurricane Season indicates that an above-normal season is most likely (60% chance), with the possibility of it being extremely active. The outlook calls for a 60% chance of an above-normal season, followed a 30% chance of a near-normal season and a 10% chance of a below-normal season. See NOAA definitions of above-, near-, and below-normal seasons.
The 2020 Atlantic hurricane season could set a record of 5 consecutive above-normal seasons, surpassing the previous record of 4 set during 1998-2001. Since the current Atlantic high-activity era began in 1995, 17 of 25 (68%) seasons have been above normal and only 4 (16%) have been below normal. A fifth consecutive above-normal season would be remarkable, considering that the previous Atlantic low-activity era of 1971-1994 featured only four above-normal seasons in 24 years.
An important measure of the total seasonal activity is NOAA’s Accumulated Cyclone Energy (ACE) index, which accounts for the combined intensity and duration of all named storms and hurricanes during the season. This 2020 outlook indicates a 70% chance that the seasonal ACE range will be 110%-190% of the median. According to NOAA’s hurricane season classifications, an ACE value between 71.4% and 120% of the 1981-2010 median reflects a near-normal season. Values above (below) this range reflect an above-normal (below-normal) season. The 2020 predicted ACE range extends well above the threshold (120% of median) for an above-normal season and even above the threshold (165% of median) for an extremely active (also called hyper-active) season.
The 2020 Atlantic hurricane season is predicted to produce (with 70% probability for each range) 13-19 named storms, of which 6-10 are expected to become hurricanes, and 3-6 of those are expected to become major hurricanes. These ranges are centered above the 1981-2010 period averages of about 12 named storms, 6 hurricanes and 3 major hurricanes.
Predicting the location, number, timing, and strength of tropical storm and hurricane landfalls are ultimately related to the daily weather patterns, storm genesis locations, and steering patterns. These patterns are not predictable weeks or months in advance. As a result, it is not possible to reliably predict the number or intensity of landfalling storms in a seasonal outlook, or whether a given locality will be impacted by a hurricane this season.
2. Science behind the 2020 Outlook
NOAA’s Atlantic hurricane season outlooks are based on predictions of the main climate factors and their associated conditions known to influence seasonal Atlantic hurricane activity. These predictions are based on extensive monitoring, analysis, research activities, a suite of statistical prediction tools, and dynamical models. The dynamical model predictions come from the NOAA Climate Forecast System (CFS), NOAA Geophysical Fluid Dynamics Lab (GFDL) FLOR model, the North American Multi-Model Ensemble (NMME), the United Kingdom Met Office (UKMET) GloSea5 model, and the European Centre for Medium-Range Weather Forecasting (ECMWF) model. El Niño/ La Niña forecasts are also provided from statistical and other dynamical models contained in the suite of Niño 3.4 SST forecasts), which is compiled by the International Research Institute for Climate and Society (IRI) and the NOAA Climate Prediction Center (CPC).
NOAA’s 2020 Atlantic hurricane season outlook reflects two main climate factors during August-October, which historically tend to produce above-normal Atlantic hurricane seasons.
1) The underlying climate factor again this season is the continuation of the high-activity era for Atlantic hurricanes, which began in 1995 in association with a transition to the warm phase of the AMO (Goldenberg et al. 2001, Bell and Chelliah 2006, Klotzbach and Gray 2008). The observed and predicted atmospheric conditions for ASO 2020 reflect the warm AMO phase, and include weaker trade winds and warmer SSTs across much of the MDR, a more conducive African easterly jet, weaker vertical wind shear, and an enhanced West African monsoon.
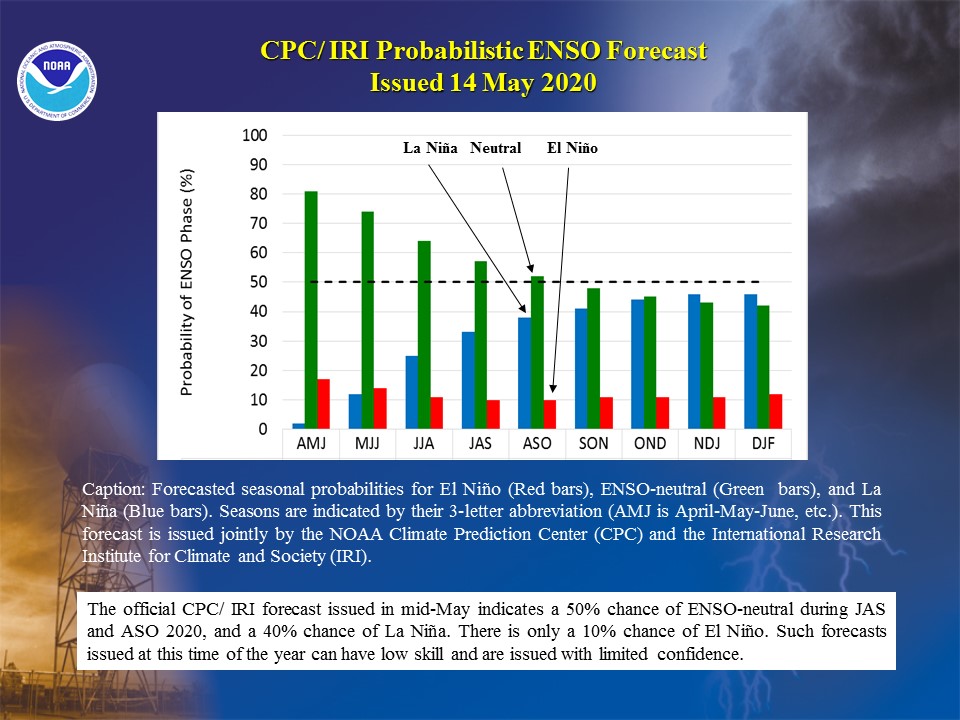
2) The most recent NOAA ENSO probability forecast indicates a 50% chance that ENSO-neutral conditions will continue through the hurricane season, and a 40% chance that La Niña could develop and be in place during the peak months (ASO) of the season.
a. ENSO-neutral or La Niña most likely
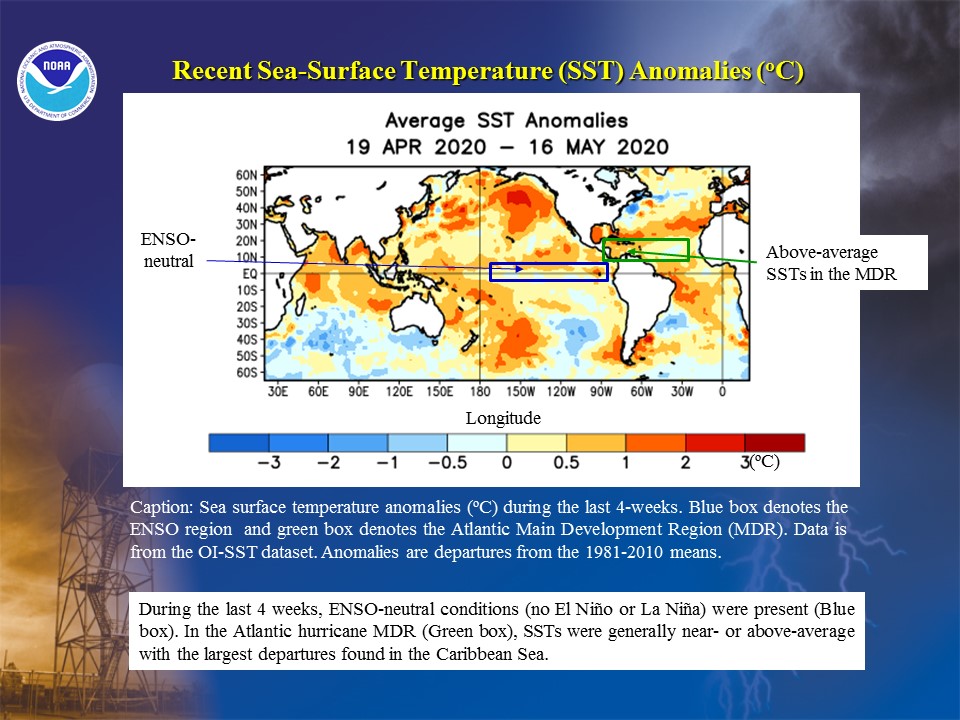
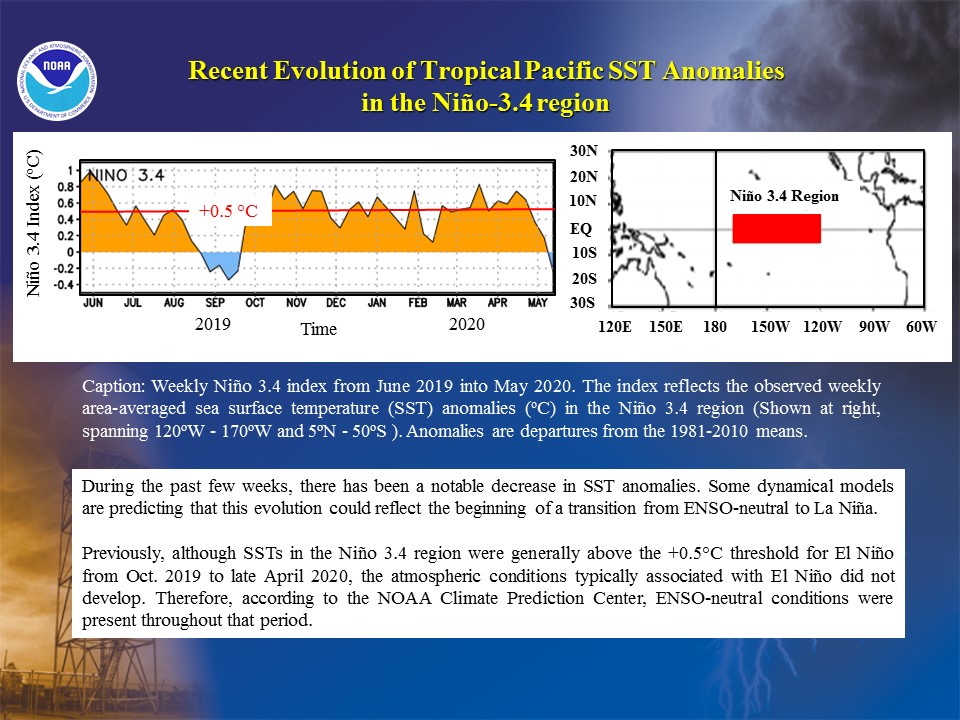
ENSO-neutral conditions are present. The latest weekly SSTs are near average across the central and eastern equatorial Pacific, and the SST index for the Niño 3.4 region is -0.3ºC. The Niño 3.4 region spans the east-central equatorial Pacific Ocean between 120°W-170°W and 5°N-5°S.
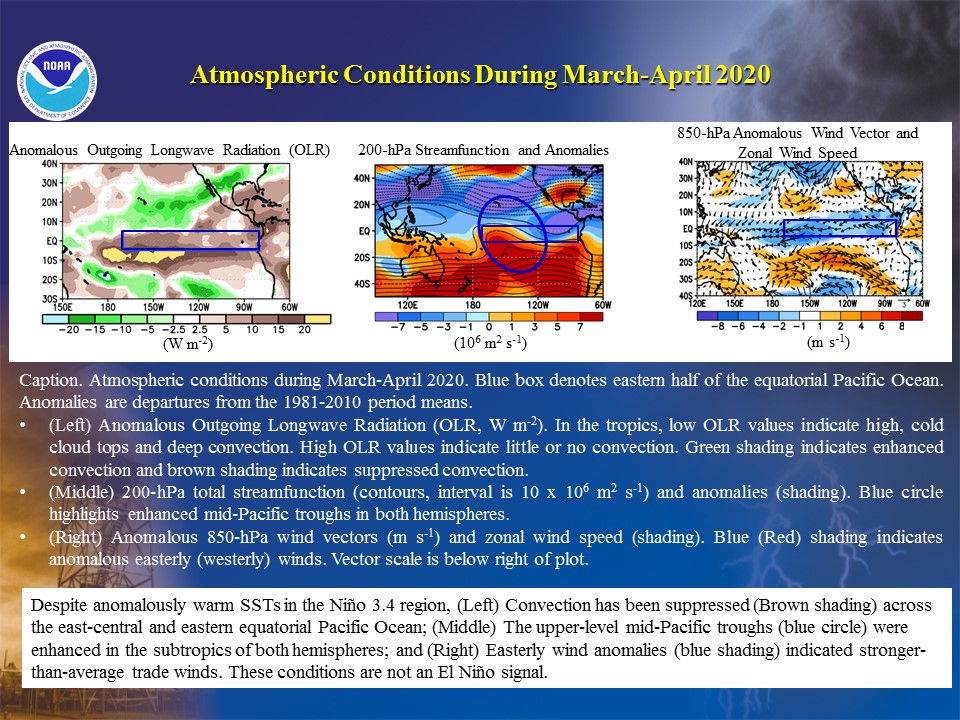
The Niño 3.4 index has recently cooled considerably. Previously this index was above +0.5ºC during October 2019 through late April 2020. However, important El Niño impacts had been largely absent, which is why the CPC did not declare an El Niño. [NOAA classifies a weak El Niño as having a sustained Niño 3.4 index between +0.5ºC and +1.0ºC, along with consistent atmospheric impacts.] For example, during March-April 2020 convection was suppressed across the east-central and eastern equatorial Pacific Ocean, and the upper tropospheric circulation at 200-hPa featured enhanced mid-Pacific troughs in the subtropics of both hemispheres. Also, the easterly trade winds were stronger-than-average across the equatorial Pacific. None of these conditions reflect an El Niño, which by comparison would feature enhanced equatorial convection east of the date line, along with weaker mid-Pacific troughs at 200-hPa and westerly wind anomalies at 850-hPa.
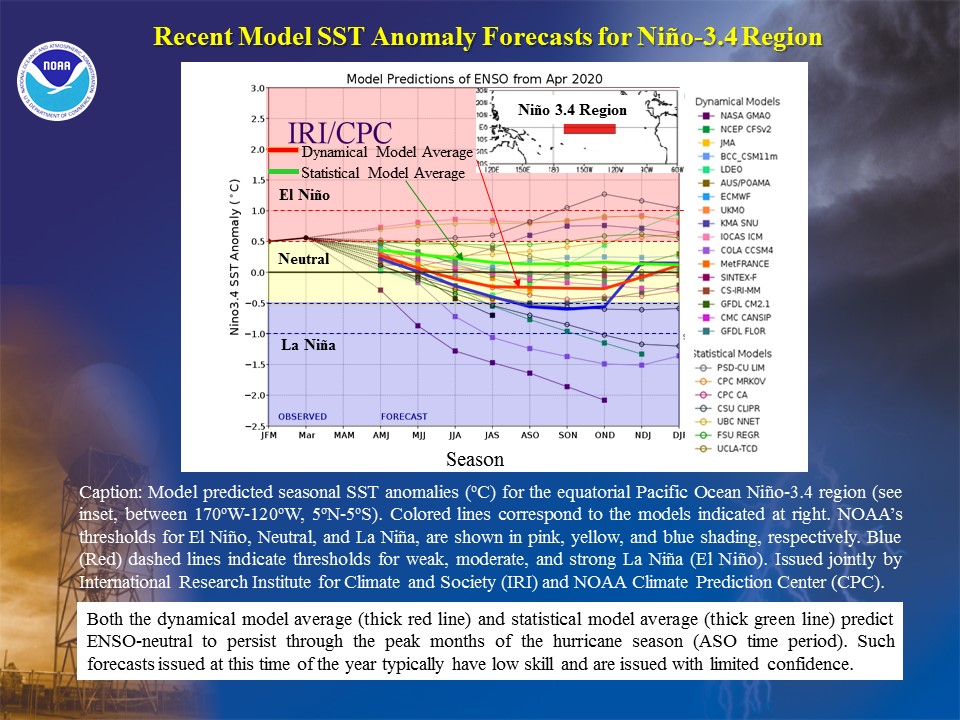
Looking forward, model predicted SST anomalies in the Niño 3.4 region generally indicate ENSO-neutral (Niño 3.4 index between ± 0.5ºC) throughout the hurricane season. The dynamical model average (red line) is on the cool side of zero, while the statistical model average (green line) is on the warm side of zero. ENSO-neutral does not inhibit Atlantic tropical storm and hurricane formation, nor does it suppress the high-activity era conditions.
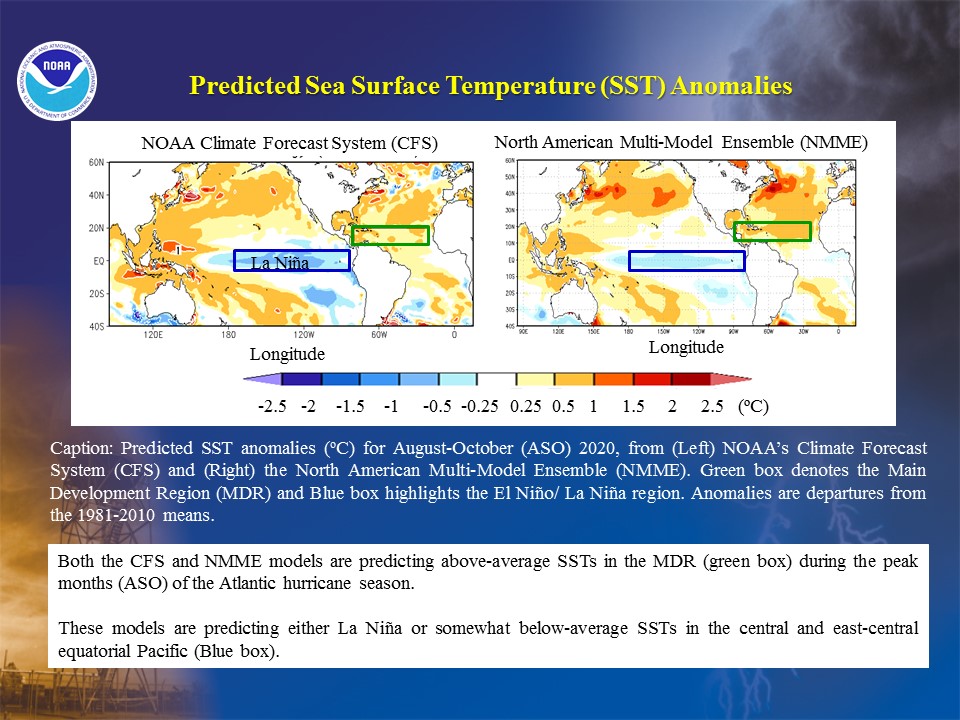
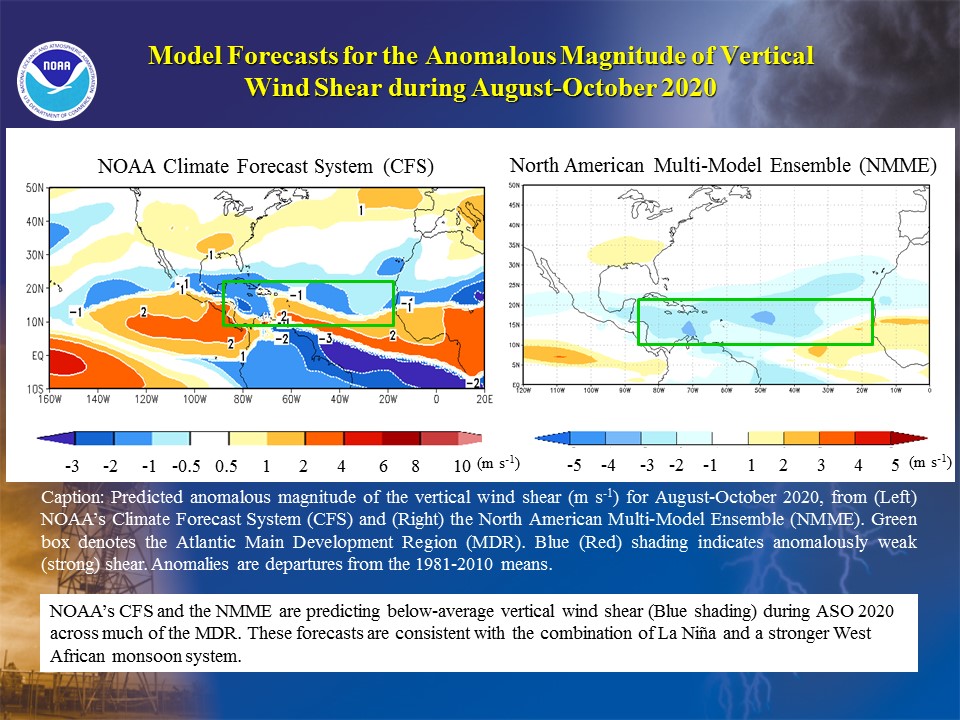
Some of the dynamical models are now indicating a transition to La Niña (Niño 3.4 index ≤ -0.5ºC) as the summer progresses, which appears to be consistent with the enhanced trade winds now present across the equatorial Pacific Ocean. NOAA’s Climate Forecast system (CFS) and the NMME are predicting either La Niña or somewhat below-average SSTs in the central and east-central equatorial Pacific during ASO 2020. Both models are predicting anomalously weak vertical wind shear within the MDR. This signal would reinforce the high-activity era conditions and further increase the likelihood of an above-normal (and extremely active) season, with activity more likely to be near the upper ends of our predicted ranges.
Based on current conditions, the recent oceanic evolution, model forecasts, and the low skill inherent in ENSO predictions made at this time of the year, NOAA’s latest ENSO outlook indicates about a 50% chance of ENSO-neutral during the peak months (ASO) of the hurricane season, followed by a 40% chance of La Niña and only a 10% chance of El Niño.
Therefore, the current hurricane season outlook reflects the expectation that the ENSO will either not compete with, or will reinforce, the ongoing set of conditions associated with the current high-activity era for Atlantic hurricanes (discussed below).
b. Predicted conditions within the MDR
SSTs are currently near- or above average across the MDR, with an area-averaged anomaly during March-April of nearly +0.5°C. For the MDR as a whole, both the CFS and NMME models predict above-average SSTs during ASO, with many areas predicted to have departures of +0.5°C to +1.0°C. While models sometimes have low skill in predicting the strength of the Atlantic SST anomalies this far in advance, these models are consistent with the ongoing warm phase of the AMO.
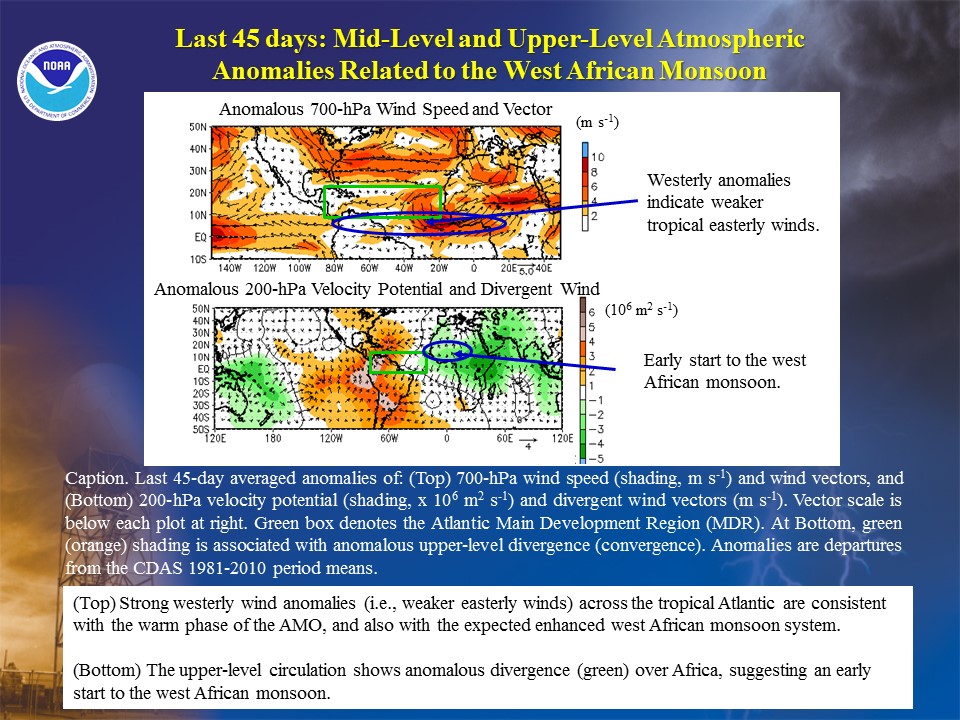
Also consistent with the warm AMO phase, two inter-related atmospheric features are now present and are expected to persist through ASO 2020. The first is anomalous westerly winds at 700-hPa across the central and eastern tropical Atlantic. The second is an enhanced West African monsoon system. These features are expected to contribute to an inter-related set of conditions during ASO within the MDR, all of which favor increased Atlantic hurricane activity. These inter-related conditions include 1) anomalously warm SSTs and decreased vertical wind shear, 2) an African Easterly Jet (AEJ) structure that allows for increased rotation of low-pressure cloud systems (also called African easterly waves) moving westward from Africa, and 3) the combination of increased moisture and decreased atmospheric stability. Because of these conditions, the enhanced African easterly waves can develop more easily into tropical storms and hurricanes, thus increasing the likelihood of an above-normal season.
The main uncertainty in this seasonal hurricane outlook is whether ENSO-neutral will persist through ASO, or whether La Niña conditions will develop. Most models are predicting ENSO-neutral, while some dynamical models are predicting a transition to La Niña as the summer progresses. As a result, there are varying predicted impacts on the seasonal activity. If La Niña does develop, it would help to reduce the vertical wind shear across the central and western MDR. This factor, in combination with the predicted high-activity era conditions above, would favor seasonal activity near the upper ends of our predicted ranges.
NOAA FORECASTERS
Climate Prediction Center
- Dr. Gerry Bell, Lead Forecaster, Meteorologist; Gerry.Bell@noaa.gov
- Matt Rosencrans, Meteorologist; Matthew.Rosencrans@noaa.gov
- Dr. Hui Wang, Physical Scientist; Hui.Wang@noaa.gov
National Hurricane Center
- Eric Blake, Hurricane Specialist; Eric.S.Blake@noaa.gov
- Dr. Chris Landsea, Meteorologist; Chris.Landsea@noaa.gov
- Dr. Richard Pasch, Hurricane Specialist; Richard.J.Pasch@noaa.gov
Hurricane Research Division
- Stanley Goldenberg, Meteorologist; Stanley.Goldenberg@noaa.gov
REFERENCES
Bell, G. D., and M. Chelliah, 2006: Leading tropical modes associated with interannual and multi-decadal fluctuations in North Atlantic hurricane activity.
J. Climate. 19, 590-612. Blake, E. S., P. Klotzbach, and G. D. Bell, 2018: Climate factors causing the extremely active 2017 Atlantic hurricane season. Presented at AMS 33rd Conference on Hurricanes and Tropical Meteorology, April 2018. Goldenberg, S. B., C. W. Landsea, A. M. Mestas-Nuñez, and W. M. Gray, 2001: The recent increase in Atlantic hurricane activity: Causes and implications.
Science, 293, 474-479. Goldenberg, S. B. and L. J. Shapiro, 1996: Physical mechanisms for the association of El Niño and west African rainfall with Atlantic major hurricane activity.
J. Climate, 9, 1169-1187. Gray, W. M., 1984: Atlantic seasonal hurricane frequency: Part I: El Niño and 30-mb quasi-bienniel oscillation influences.
Mon. Wea. Rev., 112, 1649-1668. Klotzbach, P.J., and W. M. Gray, 2008: Multi-decadal Variability in North Atlantic Tropical Cyclone Activity. J. Climate, 21, 3929-3935.
|


