Climate Prediction Center - seasonal Outlook
Skip Navigation Links www.nws.noaa.gov 
NOAA logo - Click to go to the NOAA home page National Weather Service   NWS logo - Click to go to the NWS home page
Climate Prediction Center


CPC Search
Map Explanations
   Official Fcsts
   Fcst Tools

Outlooks (Forecasts)
   Index
   Products

About Us
   Our Mission
   Who We Are

Contact Us
   CPC Information
   CPC Web Team

Official 90-day Outlooks are issued once each month near mid-month at 8:30am Eastern Time. Please consult the schedule of 30 & 90-day outlooks for exact release dates.
 
 
HOME > Outlook Maps > Monthly to Seasonal Outlooks > Seasonal Outlooks
 
About the ENSO Box and Whiskers Analysis

The box and whiskers plots represents the historical distributions of seasonal temperature and precipitation associated with 3 different ENSO categories - El Nino, La Nina, and Neutral events for each climate division. The 3-month categorizations of ENSO events that were used are available at : ENSO events

The 3-month temperature or precipitation data for a specific ENSO category is fitted to a distribution (Gaussian for temperature, Gamma for precipitation). Then a curve is fitted to the resulting distribution. From this curve, various percentiles are obtained and are plotted in the box and whiskers plot (See Fig 1.) .
 
How To Interpret The Plot
/products/precip/CWlink/ENSO/box_whiskers/explanation.png
Fig. 1

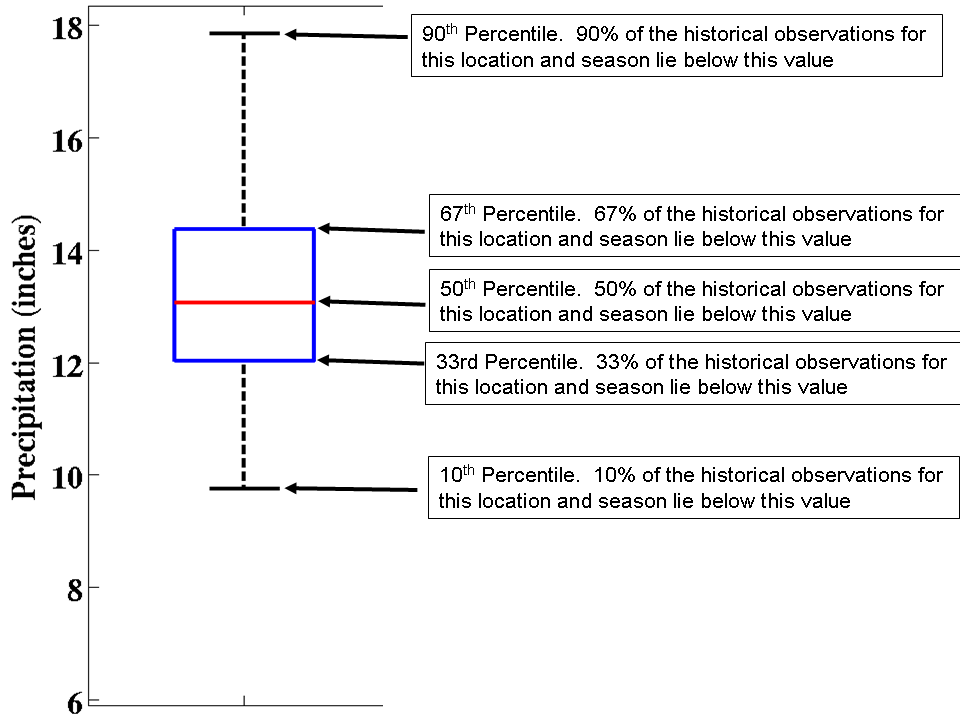
The box and whiskers plot is a way to show the range of percentiles that the temperature and precipitation fall in for the 3 different ENSO categories.

A large spread in the 3-month temperature/precipitation box and whiskers shapes between the 3 ENSO categories would indicate that ENSO has a larger influence on the temperature/precipitation for the specified climate division.

For example : if all 3 box and whiskers plots for the 3 ENSO categories have similar temperature values, this would indicate that the temperature has typically been the same regardless of the ENSO event category. If the temperature plot for the El Nino events are greatly higher than for La Nina or neutral, this would indicate that in the past the temperature has been significantly greater during El Nino events.

Dates used for data

The data used to make these plots are from 1950-present. The specific years of episodes for each of the seasons' plots can be found by going to the ENSO composites page :

ENSO Composites Page.

You can click on the corresponding 3-month period on the left bar. Under the Composite map graphics are a list of years used for these cases. These are the same used for these ENSO Box & Whiskers Plots.

ENSO Box and Whiskers Analysis
 

NOAA/ National Weather Service
National Centers for Environmental Prediction
Climate Prediction Center
5830 University Research Court
College Park, Maryland 20740
Page Author: Climate Prediction Center Internet Team
Page last modified: December 12, 2005
Disclaimer
Information Quality
Credits
Glossary
Privacy Policy
Freedom of Information Act (FOIA)
About Us
Career Opportunities