Skip Navigation Links www.nws.noaa.gov 
NOAA logo - Click to go to the NOAA home page National Weather Service   NWS logo - Click to go to the NWS home page
Climate Prediction Center

 
HOME > Monitoring and Data > Monitoring Weather & Climate > Blocking > Observed Southern Hemisphere Atmospheric Blocking


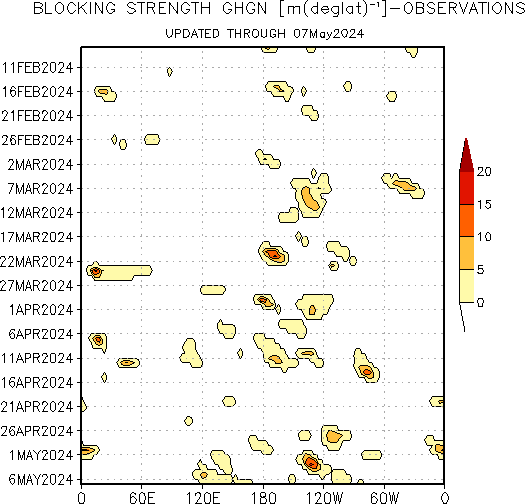
All colored regions in the hovmoller plot below depict regions where the flow is blocked according to the blocking index. The color scheme denotes the strength of the blocked flow as determined from the 500 hPa geopotential height gradient measured from the blocking ridge equatorward (denoted GHGN in blocking index definition). The presence of an intense cutoff low equatorward of the blocking ridge can act to enhance the blocking strength..

Blocking Strength Observations.
 
500 hecto Pascals Geoopotential height and Anomalies.

NOAA/ National Weather Service
NOAA Center for Weather and Climate Prediction
Climate Prediction Center
5830 University Research Court
College Park, Maryland 20740
Page Author: Climate Prediction Center Internet Team
Page last modified: January 3, 2006
Disclaimer
Information Quality
Credits
Glossary
Privacy Policy
Freedom of Information Act (FOIA)
About Us
Career Opportunities