Skip Navigation Links www.nws.noaa.gov 
NOAA logo - Click to go to the NOAA home page National Weather Service   NWS logo - Click to go to the NWS home page
Climate Prediction Center

 
HOME > Monitoring and Data > Monitoring Weather & Climate > Indices and Forecasts > Daily MJO Indices > MJO-Index and MJO-Related Influences > Historical MJO Indices
 
 
Historical MJO Indices
 

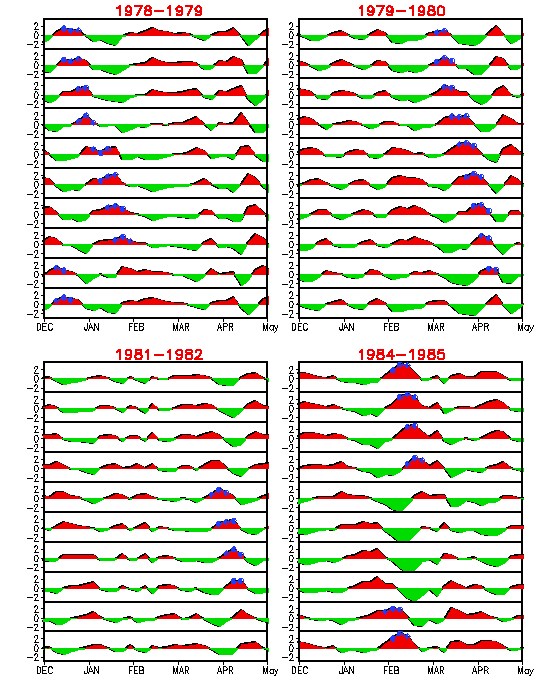
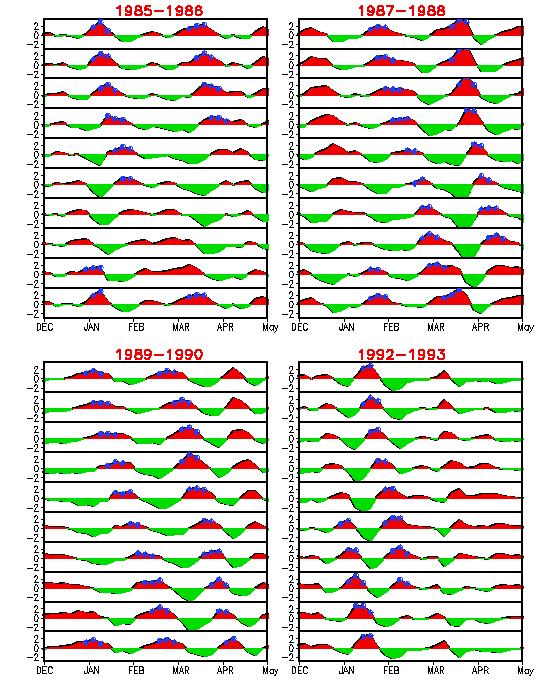
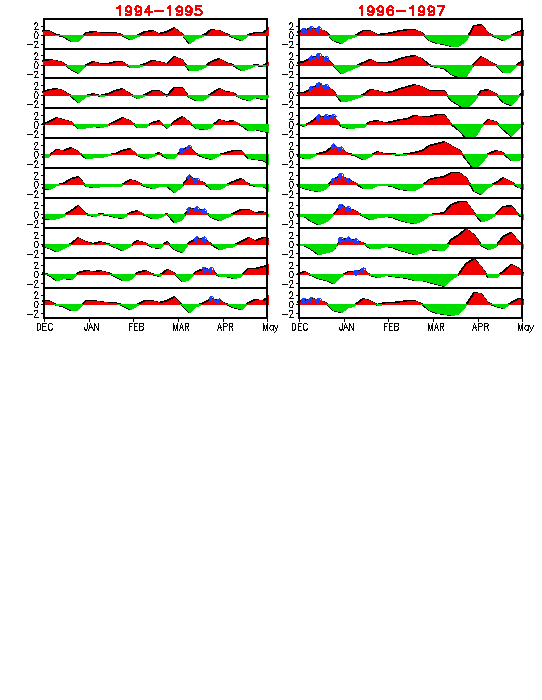
The figures below show the ten MJO indices, ordered from 1 to 10 and displayed from top to bottom, for selected winter seasons. Note that the pentad data used in the MJO composites are labeled as blue dots, and the MJO indices are standardized by the standard deviation in the ENSO-neutral and weak ENSO winters (November-April) during 1979-2000.

Historical MJO Indices

NOAA/ National Weather Service
NOAA Center for Weather and Climate Prediction
Climate Prediction Center
5830 University Research Court
College Park, Maryland 20740
Page Author: Climate Prediction Center Internet Team
Page last modified: December 22, 2005
Disclaimer
Information Quality
Credits
Glossary
Privacy Policy
Freedom of Information Act (FOIA)
About Us
Career Opportunities