[Previous Article] [Next Article]
Winter Forecast by the GISS SI97 Model
Based on Fixed SST Anomalies
contributed by a subset of the GISS "Forcings and Chaos" group:
J. Wilder, K. Beckford, S. Borenstein, L. Druyan, A. Estrella, J. Hansen, J. Knox, R. Miller, R.
Ruedy
NASA Goddard Institute for Space Studies, New York, New York
GISS climate modeling focuses on decadal time scales. But seasonal climate predictions provide
a valuable test of the model with both research and educational benefits. We are particularly
interested in understanding and contrasting the roles of forcings and chaos in interannual to
decadal climate change. Experimental seasonal forecasts provide some insight toward this
objective and also help in model assessment and model improvement.
The GISS SI97 Climate Model
The global climate model employed for the present seasonal forecast experiments (SI97) is
basically the same as the SI95 version of the model, which was recently described by Hansen et al.
(1997). We summarize the differences between the SI95 and SI97 models here. These changes
are not expected to have a large impact on the model's forecast skill, a conclusion supported by
the skill assessment in the following section.
There are three principal differences between the SI95 and SI97 models, which, respectively, were
frozen in connection with the GISS 1995 and 1997 Summer Institutes on Climate and Planets.
The first change is that the SI97 model incorporates improvements in the calculation of large scale
cloud cover (Del Genio et al., 1996). The main effect is a reduction of cloud cover at low
latitudes and thus a more realistic planetary albedo there. The second change is replacement of the
strong sea ice puddling parameterization by a more moderate and realistic parameterization, as
described by Hansen et al. (1997). The main effect is to reduce the amount of solar radiation
absorbed by the planet at high latitudes, bringing the simulated albedo into closer agreement with
observations. The third change is the introduction of higher vertical resolution versions of the
model, with the additional layers being in the upper troposphere and lower stratosphere. This
higher resolution allows radiative forcings such as those due to ozone and stratospheric aerosols
to be specified more accurately, and perhaps it allows more realistic interactions between the
stratosphere and troposphere. However the present simulations do not include climate forcing
due to changing atmospheric constituents; the only forcing employed here is specified sea surface
temperature (SST) anomalies.
Expected Forecast Skill
We do not expect the changes between SI95 and SI97 to have a large effect on the model's
forecast skill when it is used in a mode with specified ocean temperature. This expectation tends
to be confirmed by global maps of the correlation of the ensemble-mean of model simulations with
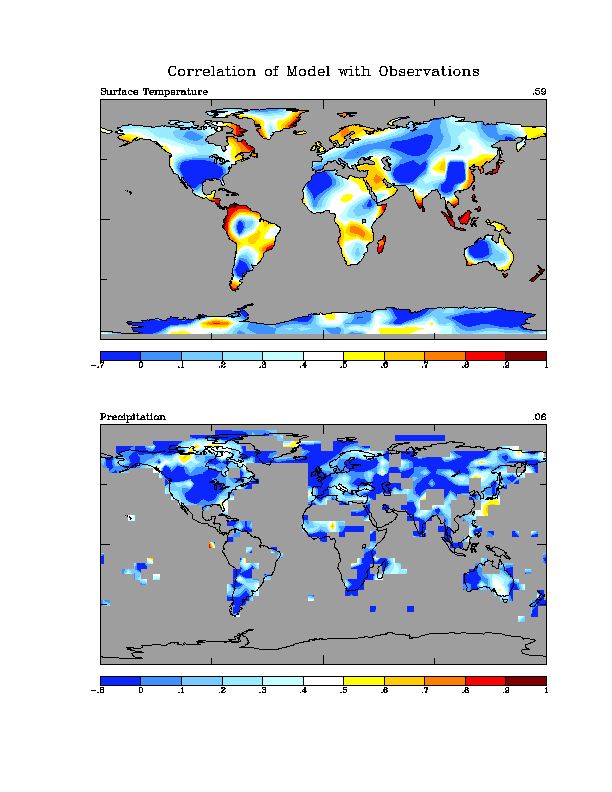
observations for the period 1979-1997. This measure of the model's skill is shown in Fig. 1 for
the SI97 model for surface air temperature and precipitation for Northern Hemisphere (NH)
winter (Dec-Jan-Feb). The ensemble of model simulations in this case was five runs with the
12-layer version of the SI97 model driven by monthly varying sea surface temperatures and sea
ice cover. Results are qualitatively similar for the 9-layer and 15-layer versions of SI95.
The median of the histogram of correlation coefficients (not shown) is positive with respect to
both surface temperature and precipitation, suggesting that the model has some predictive skill.
Over the NH extratropical continents, the correlations rarely exceed 0.4 (except near coastal
regions where surface temperature is controlled to a greater extent by the specified SST). If the
model has no predictive skill and the 18 winters are statistically independent, then the absolute
value of the correlation will be within ±0.47 as a result of random chance 95% of the time. This
suggests that predictability in the wintertime extratropics is on average small, as might be
expected from the chaotic nature of the circulation during this season. However, the model's skill
may be revealed to be statistically distinct from zero in these regions if a longer observational
record is used for comparison. Furthermore, predictability may increase during a period of
unusually strong forcing, such as an intense El Niño.
Seasonal Forecast Experiments
The forecasts were obtained simply by extending for three months the 5-run ensembles of runs
that had been made with the SI97 model using observed SSTs for the period January 1979
through November 1997. For the 3-month extension through February 1998, the SST anomalies
were kept fixed at the observed values for the last week of November 1997. Thus the only
mechanism providing any potential predictability was the observed SST anomaly. No attempt was
made to initialize the atmospheric state with observations.
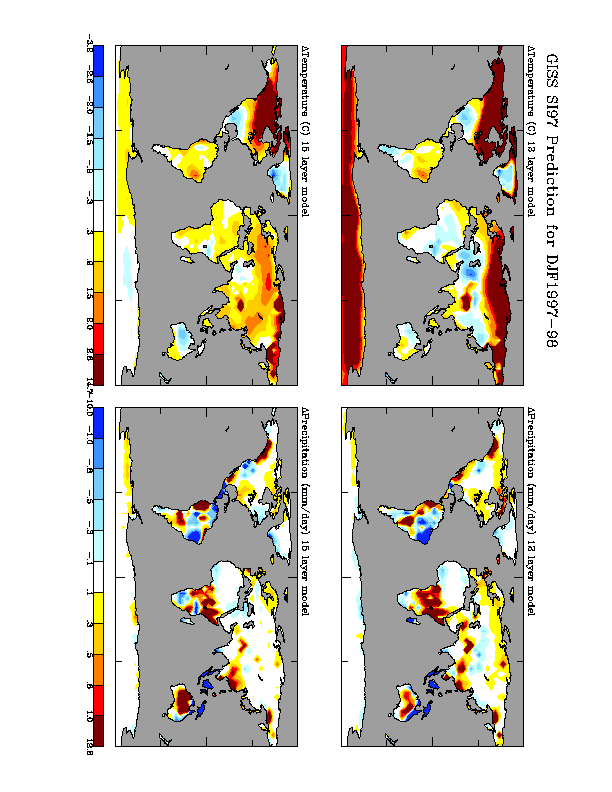
The surface air temperature and precipitation anomalies calculated for Dec-Jan-Feb are shown in
Fig. 2 for the 12-layer and 15-layer versions of the model. For the 15-layer model, the results are
5-run means. For the 12-layer case, the results are 25-run means. In this latter case, five runs
were spawned on December 1 from each of the five 1979-97 runs by inserting random changes
less than 1C in the atmospheric temperature field.
Several features in the predicted surface air temperature anomalies over land areas stand out in all
vertical resolutions (the parenthetical number is the skill for that area as measured by the
correlation coefficient in the 1979-97 simulations):
1) warm anomaly over the northern part of North America, covering most of Canada (cc ~ 0.3),
2) warm anomaly over Northern Asia and Northern Europe (cc ~ 0.1-0.3),
3) cool anomaly in northern Mexico and stretching across the southern border of the United
States (cc ~ 0),
4) warm anomaly in eastern Brazil (cc ~ 0.5),
5) cool anomaly in central-western Australia (cc ~ 0).
We note that the low correlation coefficients in the nontropical regions do not necessarily indicate
a model deficiency, because the climate variations in those regions may be primarily chaotic
(Hansen et al., 1997). Furthermore, even if this is the case, it is still possible that the model
possesses predictive skills based on SST anomalies during years with unusual SSTs.
Features in the predicted precipitation anomalies over land that stand out in the mean forecast
simulations for both vertical resolutions:
1) wet anomaly over SE Alaska (cc~0)
2) wet anomaly over northern Mexico (cc ~ 0),
3) wet anomaly over Ecuador-Peru region (cc ~ 0.8),
4) wet anomaly in SE Asia
5) wet anomaly in central Australia (cc~0.3)
6) wet anomaly over equatorial Africa (cc~0)
7) wet anomaly over parts of western Europe (cc~0).
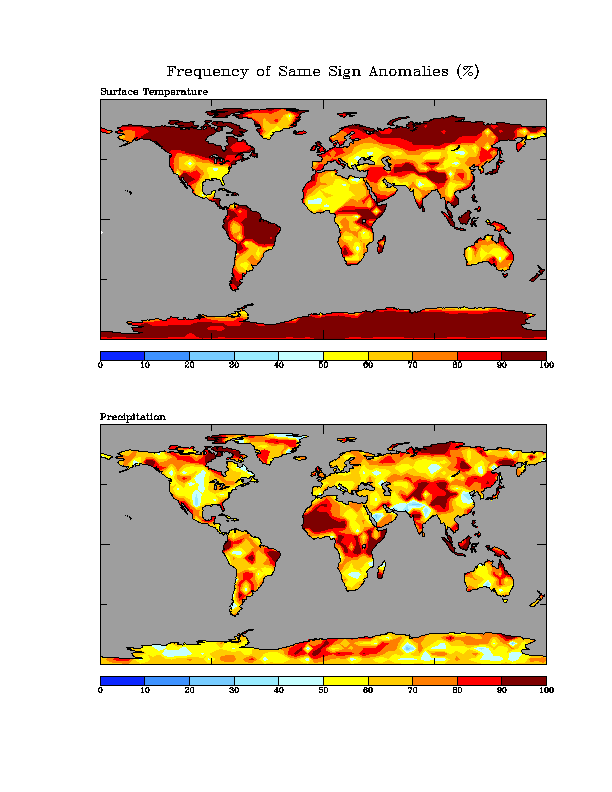
Consistency of Prediction
Because we have a large number (25) of runs for the 12-layer model it is interesting to look at the
consistency of the sign of the predicted anomalies in the forecast. Thus, for example, if at a given
gridbox 24 of the 25 runs yield an anomaly of the same sign, we define the consistency as 96%.
In those regions where the consistency is high the model is making a strong prediction, but that
does not necessarily mean that it has a high reliability. If the consistency is not much more than
50%, we would not have much confidence in the forecast.
Figure 3 shows that the forecasts of anomalous warmth in Canada, northern Asia and Europe,
Mexico and eastern Brazil, along with nearly all of the precipitation anomalies noted above (with
the possible exception of western Europe) have a high consistency. It is difficult to say what this
consistency means with regard to forecast reliability, as it depends upon model realism and on the
importance of climate forcing by (approximate, time-invariant) SST anomalies compared with
other climate forcing mechanisms. Some measure of the forecast consistency might be obtained
empirically from the forecast success rate, provided that it were verified over a sufficient number
of forecast periods.
Zimbabwe Study
Results for the Zimbabwe region were examined in more detail because of an on-going study at
GISS (Earth Observing System Interdisciplinary Science Project, "Impacts of Interannual Climate
Variability on Agro-Ecosystems and Fisheries", C. Rosenzweig, T. Busalacchie, M. Cane, D. Rind
and C.J. Tucker) and in one of the Summer Institute research groups (lead by Jennifer Phillips) of
climate impacts in that region.
Dec-Jan-Feb (DJF) precipitation rates from the 1979-1997 simulations, averaged for four grid
boxes representing Zimbabwe (16-24S, 22.5-32.5 E), were compared to rainfall rates observed at
all of the available stations in that area for DJF of each year within 1980-1993. Results from a
9-layer version of the GCM gave the highest correlation with the observed time series (Figure 4).
The correlation between the 5-run ensemble means (DJF precipitation rates) and the observations
is 0.45 which falls short of 95% confidence of statistical significance. However, the two lowest
simulated ensemble means, for 1983 and 1992, correspond to El Niño episodes and are validated
by two very dry seasons in Zimbabwe. For DJF 1992, four out of the five simulations indicated
large negative anomalies. The agreement during ENSO years is propitious for the coming
winter's forecast. The 9-layer GCM predicts a rather large deficit for DJF 1998 Zimbabwe
rainfall, again coinciding with a strong El Niño in the Pacific Ocean. Specifically, the predicted
5-run ensemble mean is only 4.0 mm/day, which is a -2.9 mm/day anomaly relative to (or 2.6
standard deviations below) the 19-year (1980-1998) ensemble mean. Confidence is additionally
enhanced since all of the five simulations agree regarding the predicted dry season, with projected
anomalies ranging from -3.6 to -2.0 mm/day.
Discussion
We emphasize that our model has not been designed for regional forecasting. These "forecasts"
are not intended for operational purposes, but rather have objectives related to research and
education. Our aim is to help understand the significance of different mechanisms in regional
climate fluctuations and to improve the realism of our climate model.
We have listed several climate anomalies that are consistently predicted by our current model for
this coming winter. These include anomalies centered in Mexico (cool, wet) and Canada (warm)
that also cover parts of the United States, especially along the southern border.
However, in most of the remainder of the United States there are not strong consistent anomalies.
Undoubtedly, as is always the case, there will be a variation of climate anomalies throughout the
United States this winter. But our model provides no basis for ascribing those anomalies to the
ongoing El Niño or sea surface temperature anomalies in general.
Del Genio, A.D., M.S. Yao, W. Kovari and K.K.W. Lo, 1996: A prognostic cloud water
parameterization for global climate models, J. Climate, 9, 270-304.
Hansen, J., M. Sato, R. Ruedy, A. Lacis, K. Asamoah, K. Beckford, S. Borenstein, E. Brown, B.
Cairns, B. Carlson, B. Curran, S. de Castro, L. Druyan, P. Etwarrow, T. Ferede, M. Fox, D.
Gaffen, J. Glascoe, H. Gordon, S. Hollandsworth, X. Jiang, C. Johnson, N. Lawrence, J. Lean, J.
Lerner, K. Lo, J. Logan, A. Luckett, M.P. McCormick, R. McPeters, R. Miller, P. Minnis, I.
Ramberran, G. Russell, P. Russell, P. Stone, I. Tegen, S. Thomas, L. Thomason, A. Thompson, J.
Wilder, R. Willson and J. Zawodny, 1997: Forcings and chaos in interannual to decadal climate
change, J. Geophys. Res., 102, 25,679-25,720.
Fig.1. Correlation of observed 1979-1997 Dec-Jan-Feb surface air temperature (A) and
precipitation (B) with 5-run mean of SI97 simulations, the model being forced by observed SST.
Fig. 2. Surface air temperature (left) and precipitation (right) anomalies for 12-layer (top, 25-run
mean) and 15 layer (bottom, 5-run mean) simulations of Dec-Jan-Feb 1997-98 with the GISS
SI97 model.
Fig. 3. Frequency of positive anomalies for surface air temperature (A) and precipitation (B)
among the 25 simulations with the 12-layer SI97 model.
Fig. 4. Zimbabwe rainfall anomalies (mm/day) as observed (heavy solid line) and as simulated by
the SI97 model (thin solid lines for the individual runs and heavy dashed line for the ensemble).
We made a programming error in the computer simulations for our
"Winter Forecast", which was published in the NOAA Experimental
Long-Lead Forecast Bulletin 6, no. 4, December 1997. The
corrected forecast is presented here.
Programming Error
The error occurred at the point in the simulation (July 1, 1997)
when we shifted from use of monthly mean sea ice cover to weekly
mean values. The weekly mean values were in fractions of areal
coverage, while the program assumed they were in percent. Thus
in the simulations from July 1, 1997 through February 28, 1998
the oceans were practically ice free (with the sea surface
temperatures of -1.6C in the regions that should have been
covered by sea ice).
This error explains why the model predicted warm conditions in
the Arctic and Antarctic regions. It also explains why the model
prediction at high latitudes had a very high consistency among
the 25 simulations. We had anticipated that chaos (unforced
variability) would be a dominant factor at high latitudes.
Our first figure in the Bulletin, the model's "predictability" as
evidenced by the correlation between the model and observations
over the period 1979-1997, is unaffected by this error. The
corrected winter forecasts of surface temperature and
precipitation for December 1997-February 1998 are given below.
Winter Forecast
The corrected forecast was obtained by extending for three months
25 independent simulations, each of which had covered the period
January 1, 1979 through November 30, 1997. For the three month
extension, December 1, 1997 through February 28, 1998, sea
surface temperature anomalies were held constant at values
observed during the last week of November 1997. Thus the only
mechanism providing any potential predictability was the observed
SST anomaly. No attempt was made to initialize the atmospheric
state with observations.
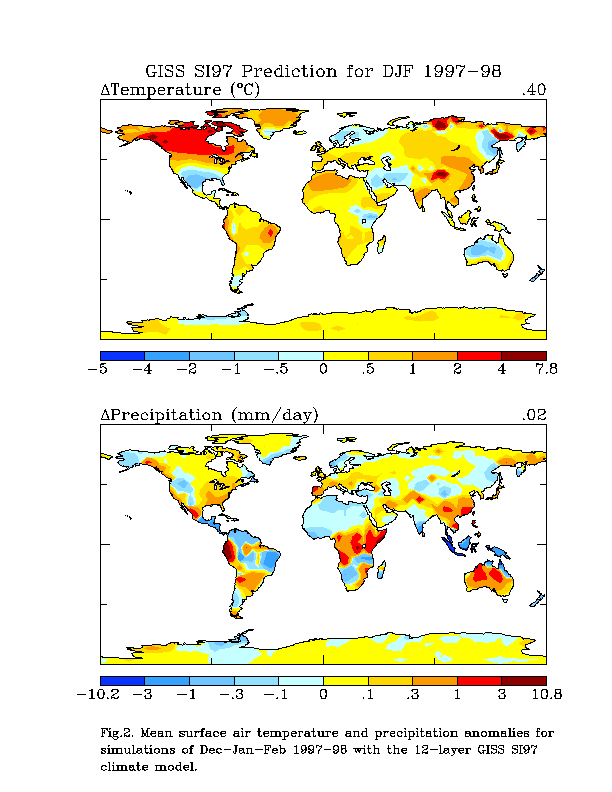
The surface air temperature and precipitation anomalies
calculated for Dec-Jan-Feb are shown in the attached replacement
Fig. 2. The results are the mean of 25 runs with our 12-layer
model.
Features that stand out in the simulated temperature anomalies
are:
1) warm anomaly over Canada and the northern part of the United States and extending over most of
Greenland,
2) cool anomaly in northern Mexico extending across the southern
United States through Florida,
3) warm anomaly across South America, especially on the west
coast (Peruvian region) and Nordeste part of Brazil,
4) warm anomaly in North Africa and southern Europe,
5) warm anomaly covering Southeast Asia (India, China, and
Japan).
Features that stand out in the simulated precipitation anomalies
are:
1) wet anomaly over the west coast of the United States, northern Mexico, and the Southeast and East
Coast of the United States,
2) wet anomaly over Ecuador-Peru region,
3) dry anomalies in Central America and eastern Brazil,
4) wet anomaly in southern Europe,
5) dry anomaly across northern Africa from the western Sahel
through the Middle East,
6) wet anomaly across tropical Africa,
7) wet anomaly across most of Australia, except the northeast,
8) dry anomaly in the islands of the East Indies.
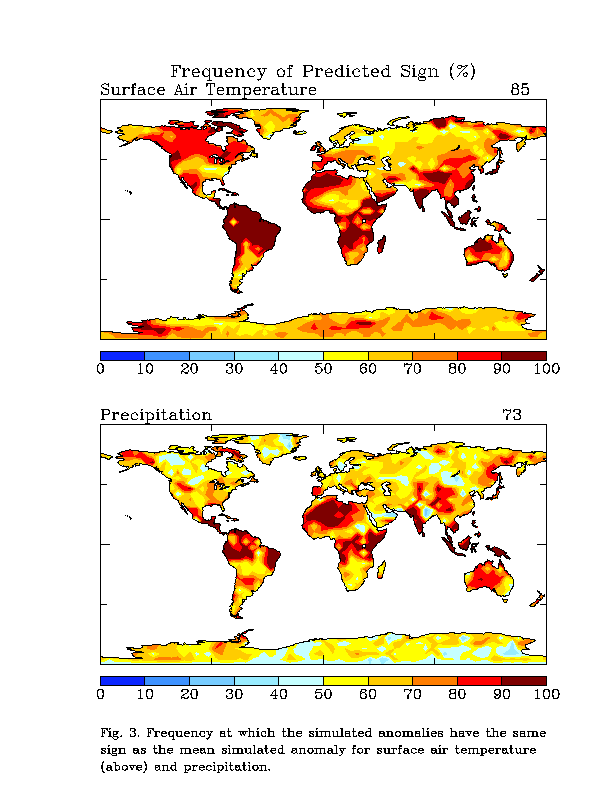
Consistency of Prediction
The "predictability" of the model is low in many parts of the
world, as judged by the correlation of the model with
observations during the period 1979-1997 (Fig. 1 in the
Bulletin). On the other hand, the probability of a correct
prediction may be higher than normal in certain years with strong
SST forcings.
The replacement Fig. 3 shows the consistency of the sign of the
predicted anomalies. Thus, for example, if at a given gridbox 24
of the 25 runs yield an anomaly of the sign of the mean anomaly,
we define the consistency as 96%. In those regions where the
consistency is high the model is making a strong prediction,
although that does not necessarily mean that it has a high
reliability. If the consistency is not much more than 50%, we
would not have much confidence in the forecast.
Figure 3 shows that almost all of the predicted anomalies listed
above have a high consistency. It is difficult to say what this
high consistency means with regard to forecast reliability, as it
depends upon model realism and on the importance of climate
forcing by (approximate, time-invariant) SST anomalies compared
with other climate forcing mechanisms. Some understanding of
this forecast consistency might be obtained empirically from the
forecast success rate, provided that it is verified over a
sufficient number of forecast periods.
Discussion
We emphasize that our model has not been designed for regional
forecasting. These "forecasts" are not intended for operational
purposes, but rather have objectives related to research and
education. Our aim is to help understand the significance of
different mechanisms in regional climate fluctuations and to
improve the realism of our climate model.
Acknowledgments. We appreciate the encouragement of the Long-Lead
Forecast Bulletin editor, Tony Barnston, the provision of sea
surface temperature data by Dick Reynolds, and the provision of
sea ice data by Bob Grumbine.
Figure Captions
Fig. 2 (replacement). Mean surface air temperature and
precipitation anomalies for simulations of Dec-Jan-Feb 1997-98
with the 12-layer GISS SI97 climate model.
Fig. 3(replacement). Frequency at which the simulated anomalies
have the same sign as the mean simulated anomaly for surface air
temperature (above) and precipitation.