[Next Article] -
[Previous Article]
Multiple Regression, Discriminant Analysis and
Unevaluated AGCM Predictions of Mar-Apr-May 1996 Rainfall in Northeast
Brazil
contributed by Andrew Colman1, Michael Davey1,
Michael Harrison2 and David Richardson2
1Ocean Applications Branch 2NWP Division
UK Meteorological Office, Bracknell, United Kingdom
Seasonal rainfall in the North Nordeste in
northeast Brazil occurs mainly from February to May,
with heaviest amounts in March and April.
Experimental forecasts of North Nordeste rainfall at 1
and 0 month leads are issued using November-January
and January-February predictor data, respectively. Two
predictors found to deliver substantial forecast skill are
(1) the 30oN-30oS portion of the third covariance-based
EOF of Atlantic SST for all seasons, and (2) the first
EOF of Pacific SST for Dec-Jan-Feb. Both of these
EOF patterns are shown in the March 1993 issue of this
Bulletin. The Atlantic EOF pattern reflects the SST
anomaly immediately off the North Nordeste east coast
and the large scale north-south SST gradient structure,
while the Pacific EOF pattern serves mainly as an index
of the ENSO situation. The amplitude time series of
these predictors are used to predict North Nordeste
rainfall both with multiple regression (giving a point
forecast) and discriminant analysis (giving probabilities
for each of five climatologically equiprobable [for
1951-1980] rainfall amount categories).
Details about the EOF analyses, the physical
relevance of the predictors, and the two forecasting
methods are given in Ward and Folland (1991).
Multiple regression develops optimal weights for each
predictor in order that the resulting linear equation
minimizes squared errors between forecasts and
corresponding observations over the training periods
(1913-94, 1946-94). In discriminant analysis, categories
of rainfall amount are defined, and, given values of the
predictors, probabilities of each of the rainfall
categories are determined using Bayes' theorem. Less
linear constraint is imposed here than in multiple
regression, as the probabilities do not necessarily
change smoothly as a function of category.
Forecasts are made for three separate North
Nordeste rainfall predictands: Nobre (for Feb-May),
Hastenrath (Mar-Apr) and Fortaleza/Quixeramobim
(FQ) (Mar-May). These are illustrated in Fig. 1. Each
of these forecasts is done using both multiple regression
and discriminant analysis. The forecasts presented here
are only for the two predictands whose periods begin in
March, making for a long-lead forecast: Hastenrath and
FQ. The Hastenrath rainfall area occupies a central
portion of the north Nordeste, while FQ is the rainfall
averaged over the two stations, one of which is in the
Hastenrath area.
If the amplitudes of the predictor EOFs are
changing rapidly during the Nov-Jan period, values
from Dec-Jan or only January may be used as
predictors, if the more recent SST anomalies are
expected to persist. In early March updated forecasts
for the predictand periods are issued, using SST data
through February.
To estimate forecast skill, multiple regression and
discriminant analysis hindcasts for FQ based on the
SST for Nov-Jan were made for the 1971-92 period
using data from 1913-70, and for the 1981-92 period
using data from 1913-80. The eigenvector patterns,
computed from 1901-80 data, cause a slight
dependency in the first experiment but complete
independence in the second. The discriminant analysis
forecast skill was assessed by comparing the observed
category with the most likely category according to the
hindcasts over the period 1971-92 (Table 1), while the
point estimate rainfall amounts predicted by multiple
linear regression were correlated with observed values.
The resulting correlation for the 1971-92 experiment is
0.715 with a bias of +0.09 standard deviations and a
root mean squared error (RMSE) of 0.62 standard
deviations. For the totally independent (including the
eigenvector pattern) period of 1981-92, the correlation
is 0.662, with bias of +0.07 and RMSE of 0.70 standard
deviations. While the latter results are not quite as high,
it is shown in Ward and
Folland (1991) that independence of the eigenvector
patterns is not nearly as critical to estimation of
independent forecast skill as independence of the periods
used for statistical model development and for forecast
testing.
                           	Observed
  	                Q1    Q2    Q3    Q4    Q5
	     Q1	4       2       0       2       0
	     Q2	0       0       0       0       0
Hindcast     Q3	0       1       1       0       0
	     Q4	0       0       0       0       0
	     Q5	1       2       0       3       6
Table 1. Hindcasts (i.e. forecasts for already observed
times, but with model derived without target years) of FQ
rainfall index for 1971-92 using linear discriminant
analysis. THE Q's are quintiles (Q1=very dry, Q5=very
wet).
Experimental real-time forecasts for FQ using the
methods discussed here have been made for each rainfall
season since 1987. The forecasters combine the forecasts
from discriminant analysis and multiple regression to
determine the official forecast category. The forecast-
observation correspondence from 1987 to 1995 is very
good for the preliminary forecast (hit rate 6.5 out of 9),
and slightly worse for the updated forecasts (4.5 out of 9).
(Over a large number of cases the updated forecasts
would be expected to have more skill.) Table 2 shows the
record of real-time forecasts for 1987-95. It is clear that
the FQ rainfall index is fairly skillfully predicted from the
two SST EOFs--in fact, as much so as most any variable
in the extratropical Pacific/North American region in any
season.
             Year:   87   88   89   90   91    92  93   94   95
  Prelim forecast     1    4    5    2    4   1.5   2    5    4
  updated forecast    1    5    5    3    4    2    2    4   4.5
  observed            1    4    5    2    4   1.5   1   4.5   5
Table 2. Verification of experimental real time forecasts
of NE Brazil rainfall (predictions of March-May rainfall
at FQ). 1=very dry, ..., 5=very wet. The number of correct
categorical forecasts out of 9 (hit rate) is 6.5 for the
preliminary (1 month lead) forecast, and 4.5 for the
updated (zero lead) forecast.
1996 Forecast
Figures 2 and 3 show the monthly time series of the
Atlantic and Pacific SST anomaly predictors used in the
regression and discriminant analysis prediction models.
Both predictor values are near average at the end of
1995, with little change between December and January.
Atlantic: SST has been mostly above average
between the equator and 30oN since November 1995.
SST was also above average off the southeast coast of
Brazil in January and in the Gulf of Guinea in November.
Elsewhere SST is near average. These SST anomalies
(apart from the Gulf of Guinea) favor drier conditions in
NE Brazil.
Pacific: SST is below average in the equatorial
central and east Pacific, in a pattern that is normally
associated with above average rainfall in NE Brazil.
However, there are negative SST anomalies north of
25oN that have the opposite rainfall influence, and the net
effect of this predictor is weak.
Example multiple regression equations for the
1-month lead forecast for the Hastenrath (for Mar-Apr)
and FQ (for Mar-May) rainfall indices (standardized
rainfall anomaly units), based on 1913-1995 data, are:
Hastenrath = 0.020 - 0.719A - 0.101P
FQ = -0.015 - 0.847A - 0.088P
where the EOF time coefficients (A=Atlantic EOF,
P=Pacific EOF) are not standardized. (The Atlantic series
varies between about -2.5 and 1.4 between 1981 and
1995, while the Pacific series varies between about -4.0
and 9.7).
For the 1-month lead linear regression predictions,
we calculate the average of predictions made using
training periods 1913-95 and 1946-95, and SST
anomalies for November, December and January. The
result is:
  predictand         forecast   quint  quint range  stand. error
  Hastenrath          -0.12       3   -.16 to .27          0.57
     FQ               -0.19       2   -.70 to -.16         0.65
The Hastenrath forecast is just above the Q2/Q3
(dry/average) quintile boundary, and the FQ forecast is
just below the Q2/Q3 boundary. The multiple regression
forecast for the Nobre (Feb-May) predictand is also very
close to the Q2/Q3 boundary. The standard errors (in
standard deviation units) associated with these forecasts
express the inherent uncertainty based on the training
period statistics.
The discriminant analysis produces the following
probabilities that the Hastenrath and FQ indices will be
in each of the quintiles for the 1-month lead time:
                very dry     dry     average    wet   very wet
  Hastenrath     .14         .33       .29      .17      .07
        FQ       .25         .25       .17      .26      .07
The discriminant analysis predictions are less
consistent than the linear regression predictions, with
some bimodal behavior, but all favor below average
rainfall.
Our best estimate forecast is for DRY/
AVERAGE conditions (quint 2/3 boundary) for each
of the rainfall indices (Hastenrath, FQ, Nobre).
As in 1994 and 1995, a dynamical prediction of
Northeast Brazil rainfall was made using a version of the
UKMO climate atmospheric general circulation model
(AGCM). A similar version of the AGCM showed very
high skill in simulating interannual variability of
Northeast Brazil rainfall when forced with observed SST.
The 1994 and 1995 AGCM forecasts were in good
agreement with the statistical predictions. However, skill
with persisted SST anomalies has not yet been fully
assessed. The AGCM was run from Jan 23, Jan 31 and
Feb 1 start dates, using persisted January SST anomalies,
to the end of May. All three samples give below average
March-May rainfall for NE Brazil, with a net value about
10% below average for the season compared to the model
climatology.
Although there is agreement between the statistical
and dynamical predictions, confidence in predictions of
near-average conditions is generally lower than that for
extremes, so overall confidence in this forecast is
moderate.
UPDATED (ZERO-LEAD) FORECASTS, WITH
INCLUSION OF FEBRUARY DATA
While zero-lead forecasts are not encouraged for
this Bulletin, they appear here as auxiliary information
accompanying long-lead forecasts for the same targets. In
February the Atlantic predictor decreased sharply while
the Pacific predictor increased slightly (see Figs. 2, 3).
Consequently the zero-lead statistical forecasts
indicate wetter conditions (average at the time of
writing) than the 1-month lead forecast.
References
Ward, M.N. and C.K. Folland, 1991: Prediction of
seasonal rainfall in the North Nordeste of Brazil using
eigenvectors of sea surface temperature. Int. J. Climatol.,
11, 711-743.
Figures
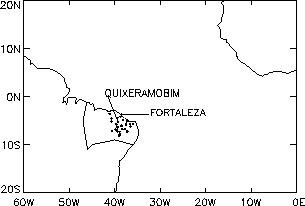
Figure 1. Locations of the stations used in the Hastenrath rainfall
time series, and the Fortaleza and Quixeramobim stations. The Nobre
rainfall time series is based on stations throughout the bounded
region indicated.
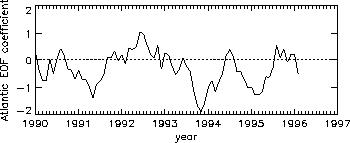
Figure 2. Amplitude time series for the Atlantic eigenvector for Jan
1990 to Feb 1996. Positive values (e.g. SST anomalies warm in north
tropical Atlantic, cool in south tropical Atlantic) are associated
with drier conditions.
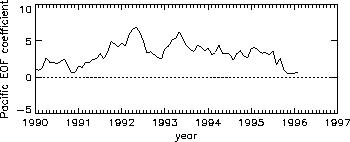
Figure 3. Amplitude time series for the Pacific eigenvector for Jan
1990 to Feb 1996. Positive values (e.g. SST anomalies warm in the
central-east equatorial Pacific, cool in the northwest and southwest
Pacific) are associated with drier conditions.
[Purpose] -
[Contents] -
[Editorial Policy] -
[Next Article] -
[Previous Article]