Figures
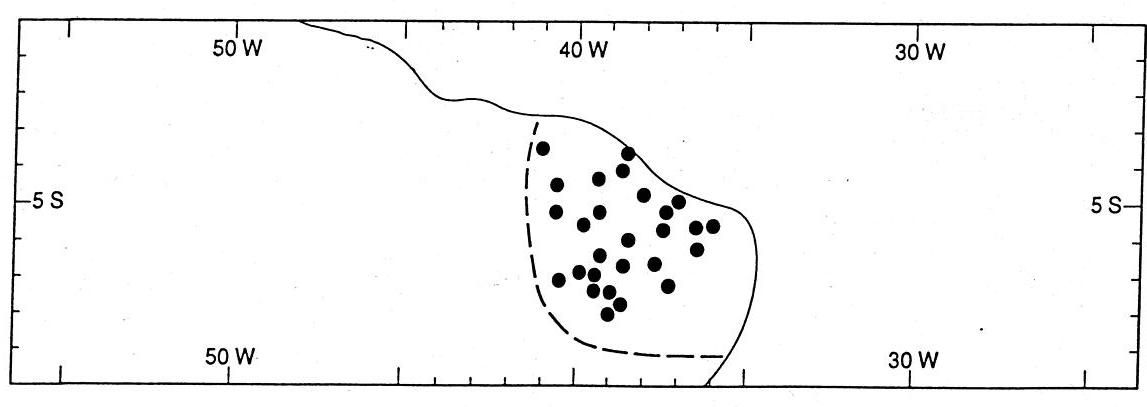 Fig. 1. Locations of the 27 selected stations in the Nordeste, used
as the predictand by Greischar and Hastenrath.
Fig. 1. Locations of the 27 selected stations in the Nordeste, used
as the predictand by Greischar and Hastenrath.
In the approach used at the University of Wisconsin to forecast March-to-June precipitation in the Nordeste, several predictors are used with stepwise multiple linear regression and linear discriminant analysis. The predictand includes 27 selected stations in the Nordeste (Hastenrath and Greischar 1993), shown in Fig. 1. The forecasts shown here are made at one month lead--i.e., using data no later than January 1996. The potential predictors of March-June Nordeste rainfall (not all of which are necessarily used in a given prediction model) are listed below along with their correlations with the predictand over the training period, 1921-57. Correlation coefficients are in hundredths, with one and two asterisks indicating significance at the 5% and 1% levels, respectively.
(1) October-January precipitation at the 27 predictand stations. +55**
(2) An index of January meridional surface wind component over the tropical Atlantic, 30oN-30oS. -35*
(3) An index of January SST in the equatorial Pacific. -11
(4) An index of January SST in the tropical Atlantic, 30oN-30oS. -57
(5) An index of Nov-Dec-Jan SST in the tropical Atlantic, 30oN-30oS. -70**
As shown above and described in Hastenrath and Greischar (1993), March-to-June rainfall in the Nordeste is correlated positively with the first and negatively correlated with all the other predictors. This pre-season, predictor values have been: (1) slightly positive precipitation departure, (2) somewhat positive anomalous meridional wind component (i.e. southerly wind anomaly), (3) slightly negative tropical Pacific SST anomaly, (4) moderately strong positive tropical Atlantic SST index for January (i.e. warmer/colder North/South Atlantic SST), and (5) somewhat positive tropical Atlantic SST index for Nov-Dec-Jan (as in (4)). The Atlantic SST field and meridional surface wind component indicate slightly dry March-June 1996 conditions, while pre-season Nordeste rainfall and the equatorial Pacific SST point to wetter conditions.
Table 1 shows skill evaluations for eight prediction models, each using a different combination of the predictors listed above. The eighth model uses a neural network rather than stepwise multiple linear regression.
		                                 Skill (% Variance Explained)   Rainfall
                             		-------------------------------------   Forecast
                             		Training  	Forecast  Forecast   	Mar-Apr-
	Model     Predictors        	Period   	Period 1  Period 2   	May-Jun
 	#/Type  	 Used          	1921-57   	1958-89   1968-89     	1996
	------  ----------------     	--------  	--------  --------   	--------
 	1 SMR  (1)                     	30       	  35        49        	+.44
	2 SMR  (1),(2)                	38       	  49        69        	+.30
	3 SMR  (1),(4)                	49       	  52        66        	+.04
	4 SMR  (1),(2),(4)          	44       	  58        74        	 -.08
	5 SMR  (1),(2),(3),(4)          50       	  61        74        	+.03
	6 SMR  (1),(3),(5)              62       	  61        71        	+.04
	7 SMR  (3),(5)                 	56       	  58        62        	 -.19
	8 NN    (1),(2),(3),(4)         55       	  66        81        	+.15
Table 1. Skill of eight prediction models for Mar-Apr-May-Jun Nordeste rainfall (expressed as a percentage of predictand
variance explained), followed by the forecast standardized Nordeste rainfall anomaly for Mar-Apr-May-Jun 1996. The model
type is SMR (stepwise multiple regression) or NN (neural network), and predictors numbers (1)-(5) are as shown above.
The models indicate near average Nordeste precipitation, with a slight tilt toward the high side of the normal. The 1912-56 historical mean and standard deviation are 500 and 60 mm, respectively.
Using the same sets of predictors, Nordeste rainfall was also predicted using linear discriminant analysis, in which five equiprobable categories of rainfall amount are defined and associated with predictor values using Bayes' theorem. In an individual forecast each of the categories is assigned a probability, given the pre-season values of the predictors. Table 11-2 in the March 1995 issue of this Bulletin shows, for predictor models 5 and 7, the five-by-five verification matrices obtained over the 1958-89 period using from the earlier years to develop the models. The hit rates are 0.34 and 0.38, corresponding to Heidke skills of 0.18 and 0.22 and expected correlation skills of about 0.55 and 0.65. The quintile probability forecasts for Mar-Apr-May-Jun 1996 using each of these predictor models are:
                        Probability of.....

	Model   Predictors	  Q1    Q2    Q3    Q4   Q5
	5	(1),(2),(3),(4)	 .17   .20   .14   .30   .19
	7	(3),(5)		 .18   .28   .25   .21   .08
Model 5 shows a maximum likelihood of a somewhat wetter than normal 1996, although Q2 (somewhat dry) has the second highest probability. Model 7 indicates a tendency for somewhat drier than normal conditions. If the probabilities given by the two models are added for each category, the result is a forecast for an average season, but with considerable likelihood for a one-category deviation in either direction from the middle category.
In summary, both the field of meridional wind component and the SST pattern (and the associated OLR pattern that is not shown) in the Atlantic indicate slightly below normal March-June 1996 Nordeste precipitation, while the positive pre-season Nordeste rainfall anomaly and the cool tropical Pacific SST favor drier conditions. Based on the several stepwise multiple regression and linear discriminant analysis models, near average conditions are forecast for the 1996 rainy season with standardized anomalies of -0.2 to +0.4. This is comparable to the years 1978, 81, 87, and 91.
Hastenrath, S. and L. Greischar, 1993: Further work on the prediction of northeast Brazil rainfall anomalies. J. Climate, 6, 743-758.
Fig. 1. Locations of the 27 selected stations in the Nordeste, used
as the predictand by Greischar and Hastenrath.