[Next Article] -
[Previous Article]
Precipitation Forecasts for the Tropical Pacific
Islands Using Canonical Correlation Analysis (CCA)
contributed by Yuxiang He and Anthony Barnston
Climate Prediction Center, NOAA, Camp Springs, Maryland
In canonical correlation analysis (CCA), relation-ships between multicomponent predictors and
multicom-ponent predictands are linearly modeled.
These typically take the form of pattern-to-pattern
relationships in space and/or time. CCA is designed to
minimize squared error in hindcasting linear combinations of predictand elements from linear combinations
of the predictor elements.
CCA has been used in the social sciences for many
decades, but only in the last 10 years has it begun being
used in the atmospheric sciences. For example, Barnett
and Preisendorfer (1987) applied CCA to monthly and
seasonal prediction of U.S. temperature. Graham et al.
(1987a,b) and Barnston and Ropelewski (1992) applied
it to predicting aspects of the ENSO phenomenon, and
Barnston (1994) forecasted short-term climate
anomalies in the Northern Hemisphere. Recently,
Barnston and He (1996) explored CCA as a tool for
seasonal temperature and precipitation forecasts for
Hawaii and Alaska. The skills resulting from the latter
two studies, while generally modest, were high enough
for the U.S. National Weather Service to use the
forecasts on a real-time, operational basis.
Here, CCA is used to predict 3-month total
precipitation anomalies in the Pacific Islands out to a
year in advance, as described in He and Barnston
(1996). It is known from past work that rainfall in the
tropical and subtropical Pacific is strongly related to
ENSO (Ropelewski and Halpert 1987). Therefore it is
worthwhile to set up a seasonal prediction system that
produces real-time forecasts on a monthly basis for the
benefit of agricultural and commercial interests in the
Pacific Islands.
The predictor fields used for the forecasts include
quasi-global sea surface temperature (SST), Northern
Hemisphere 700 mb geopotential height, and the
precipitation itself over the 33 stations used as the
predictand. Experiments with different subsets of
predictors and predictor field weights showed that the
most valuable predictor field is SST, with 700 mb
heights and prior precipitation somewhat helpful. The
SST predictors are therefore given double their natural
weight. Further details about the skills, the underlying
relationships, and the need to weight the SST double
are provided in He and Barnston (1996). The set of
predictors is configured as four consecutive 3-month
periods prior to the time of the forecast, followed by a
variable lead time, and then a single 3-month predictand
period. The predictand includes 3-month total rainfall
at 33 Pacific Island stations within 25oN-30oS,
including 4 Hawaiian stations. The lead time is defined
as the time between the end of the final (fourth)
predictor period (i.e., the time of the forecast) and the
beginning of the 3-month predictand period. This strict
definition contrasts with that in which the shortest lead
forecast would be called 3-month lead instead of zero
lead.
The expected skill of the forecasts was estimated
using cross-validation, in which each year in turn was
held out of the model development sample and used as
the forecast target. These skill estimates indicated that
at 1 month lead time the highest correlation skill across
the Pacific Islands occurs in Jan-Feb-Mar at 0.44 (0.29)
averaged over all stations north (south) of the equator,
and the lowest occurs from September through
December at about 0.15 (0.30) for stations north (south)
of the equator. At four months lead skills are only
slightly lower except for the Jan-Feb-Mar average skill
north of the equator which drops significantly to 0.26.
Figure 1a shows standardized precipitation
anomaly forecasts for 33 Pacific Island stations for Jul-Aug-Sep 1996 made using data through Feb 1996 (3
months lead). The geographical distribution of expected
skill for this forecast, based on cross-validation, is
shown in part (b) in terms of a correlation between
forecasts and observations. The forecasts are fairly
weak in amplitude. However, a tendency toward
positive rainfall anomalies is noted north of 10N.
While this response agrees with the findings of
Ropelewski and Halpert (1987) for the cold phase of
ENSO, that response was found to be limited to the
cold half of the Northern Hemisphere year. However,
Barnston and He (1996) showed that the expected
effects from either phase of ENSO may continue for
several additional seasons in Hawaii. This delay may be
caused partly by lingering SST anomalies off the
equator at higher tropical latitudes. Presently the east-west band of negative SST anomalies along the
equator in the central and eastern Pacific has not
expanded north of 10N, except near Central America.
More detailed forecasts for 9 U.S.-affiliated Pacific
Island stations, located as shown in Fig. 2, are provided
in Fig. 3. In the latter figure, long-lead rainfall forecasts
from 1 to 13 seasons lead are shown (solid bars), along
with their expected skills (lines). The horizontal axis
reflects the lead time, whose corresponding actual target
period for this forecast is indicated in the legend along the
top of the figure (e.g. 1=AMJ 1996). The same ordinate
scale is used for both forecasts and skills (standardized
anomaly and correlation, respectively).
The skill curve applies to the target season for the
associated lead time of the present forecast. Sometimes a
"return of skill" occurs as the lead is increased because a
more forecastable target season has been reached. The
forecasts and their skills differ as a result of both location
differences within the Pacific basin and differences in
orientation with respect to the local orography (if any)
and subsequent exposure to the prevailing low-level wind
flow. We note that at most stations no substantial
anomalies in either direction are predicted in the next few
months. It should also be noted that the expected skill for
the boreal warm half of the year is generally relatively
low. However, enhanced rainfall is predicted with modest
but usable skill at Johnston Island this summer. At longer
lead, a tendency for dryness is noted for boreal winter
1996-97 at Wake, Yap and Johnston Islands. While the
associated skills are not high enough to react with
concern at this point, expected skill will slowly rise as the
lead time decreases.
The CCA modes (not shown) emphasize ENSO as
the leading influence on tropical Pacific climate, but most
strongly during the months of Nov-Dec-Jan-Feb-Mar-Apr-May (and even earlier than Nov along the immediate
equator near and somewhat east of the dateline). Mild to
moderate cold episode conditions have now prevailed for
about 9 months. Their effect on the forecasts has begun
overshadowing that of the long warmish period that
ended in spring 1995, although the forecast magnitudes
are weak. Another important mode is a long-term trend
related to a warming of the global tropical SST. This
mode can cause the forecasts to repeat from one year to
the next at given times of the year, and may govern the
forecasts by a higher proportion in the northern summer
when ENSO's influence is diminished at many of the off-equator stations.
References
Barnett, T.P. and R. Preisendorfer, 1987: Origins
and levels of monthly and seasonal forecast skill for
United States surface air temperatures determined by
canonical correlation analysis. Mon. Wea. Rev., 115,
1825-1850.
Barnston, A.G., 1994: Linear statistical short-term
climate predictive skill in the Northern Hemisphere. J.
Climate, 5, 1514-1564.
Barnston, A.G. and C.F. Ropelewski, 1992:
Prediction of ENSO episodes using canonical correlation
analysis. J. Climate, 7, 1316-1345.
Barnston, A.G. and Y. He, 1996: Skill of CCA
forecasts of 3-month mean surface climate in Hawaii and
Alaska. J. Climate, 9, submitted..
Graham, N.E., J. Michaelsen and T. Barnett, 1987a:
An investigation of the El Nino-Southern Oscillation
cycle with statistical models. 1. Predictor field
characteristics. J. Geophys. Res., 92, 14251-14270.
Graham, N.E., J. Machaelsen and T. Barnett,
1987b: An investigation of the El Nino-Southern
Oscillation cycle with statistical models. 2. Model
results. J. Geophys. Res., 92, 14271-14289.
He, Y. and A.G. Barnston, 1996: Long-lead
forecasts of seasonal precipitation in the tropical Pacific
islands Using CCA. J. Climate, 9, in press.
Ropelewski, C.F. and M.S. Halpert, 1987: Global
and regional scale precipitation patterns associated with
the El Nino/Southern Oscillation. Mon. Wea. Rev., 115,
1606-1626.
Figures
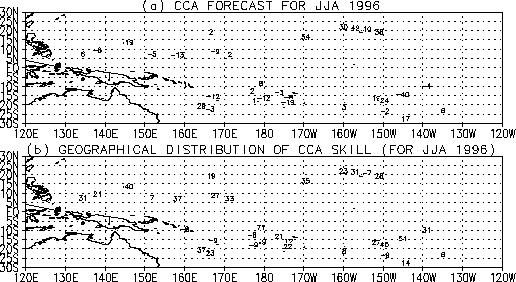
Figure 1. (a): CCA-derived
precipitation standardized anomaly forecast (X100) for 33 Pacific
Islands stations for Jun-Jul-Aug 1996 made at 3 months lead (latest
data February 1996). (b): The cross-validated skill expected for the
forecast shown in (a), expressed as a correlation X100.
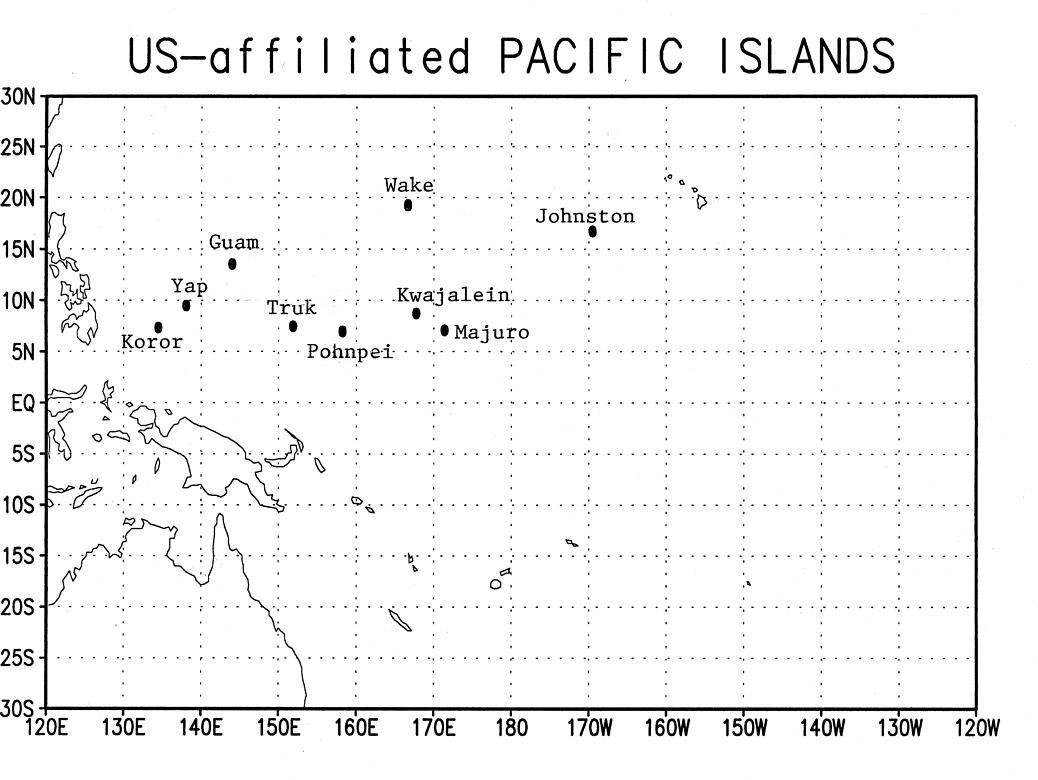
Figure 2. Locations of the 9
U.S.-affiliated Pacific Island stations whose long-lead precipitation
forecasts are shown in detail in Figure 3.
Figure 3. Time series of
CCA-based long-lead precipitation anomaly forecasts, and their expected
skills, out to one year into the future for 9 U.S.-affiliated Pacific
Island stations (see Figure 2). The bars indicate the forecast values
(as standardized anomalies) and the lines indicate the associated
skills (as correlation coefficients). Both forecasts and skills
use the same ordinate scale. The target season is indicated on the
abscissa, ranging from 1 (Apr-May-Jun 1996) through 13 (Apr-May-Jun
1997); see the legend at top.
[Purpose] -
[Contents] -
[Editorial Policy] -
[Next Article] -
[Previous Article]