[Next Article] -
[Previous Article]
Canonical Correlation Analysis (CCA) Forecasts of
Canadian Temperature and Precipitation -- Apr-May-Jun 1996
Contributed by Amir Shabbar
Atmospheric Environment Service, Environment Canada, Downsview, Ontario, Canada
ashabbar@ccrdp03.dow.on.doe.ca
In the last two issues of this Bulletin, forecasts of
Canadian temperature and precipitation using the
multivariate statistical technique of canonical
correlation analysis (CCA) were presented. For Canada,
we have developed the predictive relationships between
evolving large scale patterns of quasi-global sea surface
temperature, Northern Hemisphere 500 mb circulation,
and the subsequent Canadian surface temperature and
precipitation. In this issue we present the forecasts for
Apr-Jun 1996 using the predictor fields through
February 1995. These forecasts are made with a lead
time of 4 months, where lead time is defined as the time
between the end of the latest predictor season and the
end of the predictand season. Further detail about the
Canadian CCA-based seasonal climate prediction is
found in Shabbar (1996a, 1996b) and Shabbar and
Barnston (1996).
Figure 1(a) shows the CCA-based temperature
forecast for the 3 month period of April-June 1996
expressed as standardized anomaly. Table 1 shows the
value of the standard deviation in C at selected
stations. The mean skill over all 51 stations is given in
the caption beneath each forecast map. The field
significance is also shown, reflecting the probability of
randomly obtaining overall map skill equal to or higher
than that which actually occurred. Field significance is
evaluated using a Monte Carlo procedure in which the
forecast versus observation correspondences are
shuffled randomly 1000 times. The field of
cross-validated historical skill (correlation) for the
forecast time period is shown in Figure 1(b). The
forecast has a modest expected skill: a mean national
score of 0.14 and a field significance of 0.082. The skill
of the temperature forecast drops off considerably in
spring in Canada (see the September 1995 issue of this
Bulletin, page 28). Local skills are highest over the
northern Canadian Prairies, and modest skill is found on
the west coast of Canada. A large area of the country
from the Rockies to Hudson Bay is expected to
experience a negative temperature anomaly; positive
temperature anomalies are forecast for both coasts.
Figure 2(a) shows the CCA-based precipitation
forecast for the 3 month period of April-June 1996
expressed as a standardized anomaly. Table 1 shows the
value of the standard deviation (mm) at selected
stations. Cross-validated historical skill (correlation) for
this time period is shown in Figure 2(b). The forecast
has moderate expected skill: a mean national score of
0.14 and a field significance of 0.050. Local skills are
highest over sections of the Prairies, over southwestern
British Columbia and the east coast. Large areas of
Canada extending from Saskatchewan to Quebec are
expected to have a deficit in April-June precipitation.
The largest deficit is forecast in central Saskatchewan.
An excess in spring precipitation is expected over
central regions of British Columbia and the east coast
of Canada.
Following the normal evolution of the current cold
ENSO episode, some models are projecting a return to
normal conditions in the central and eastern equatorial
Pacific by the middle of 1996. The April-June '96
forecast recognizes the near future demise of the current
cold ENSO episode which started in the middle of last
year, and also reflects the decreasing influence of
ENSO in the warm half of the year as compared with
winter and the first half of spring. Nonetheless, the
April-June forecast reflects a strong component of
persistence from the winter circulation pattern.
Table 1. Standard deviation of temperature
(Temp) and precipitation (Prcp) for the 3 month period
April through June at selected Canadian stations.
         	Temp	Prcp

Station      	(oC)     (mm)
Whitehorse	 1.6	 13.2
Fort Smith	 2.5	 19.5
Innujjuak	 1.9	 18.2
Eureka		 2.6	  3.5
Vancouver	 1.3	 26.6
Edmonton	 1.7	 26.3
Regina		 2.1	 30.9
Winnipeg	 2.2	 37.4
Churchill	 2.1	 24.6
Moosonee	 1.9	 27.6
Toronto		 1.6	 30.0
Quebec City 	 1.3	 35.3
Halifax		 1.2	 42.7
St. John's	 1.6	 46.6
References
Shabbar, A., 1996a: Seasonal prediction of
Canadian surface temperature and precipitation by
canonical correlation analysis. Proceedings of the 20th
Annual Climate Diagnostics Workshop, Seattle,
Washington, October 23-27, 1995, in press.
Shabbar, A., 1996b: Seasonal forecast of
Canadian surface temperature by canonical correlation
analysis. 13th Conference on Porbability and Statistics
in the Atmospheric Sciences. American Meteorological
Society, San Francisco, California, February 21-23,
339-342.
Shabbar, A. and A.G. Barnston, 1996: Prediction
of
Canadian seasonal temperature and precipitation using
canonical correlation analysis. Mon. Wea. Rev., 124,
accepted.
Figures
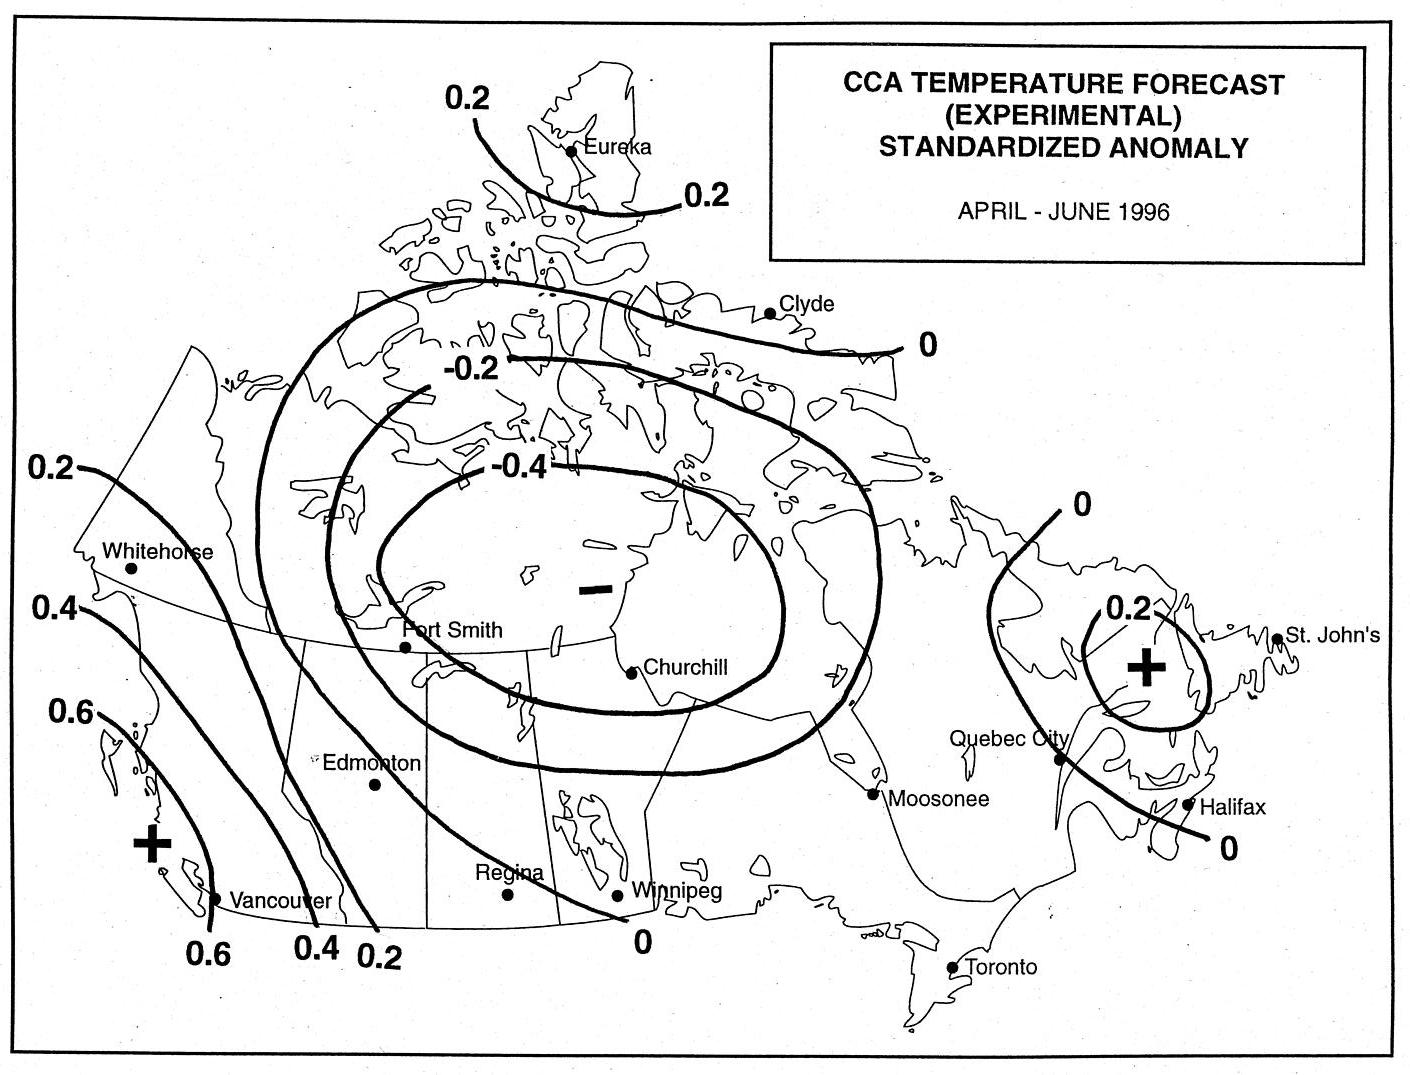
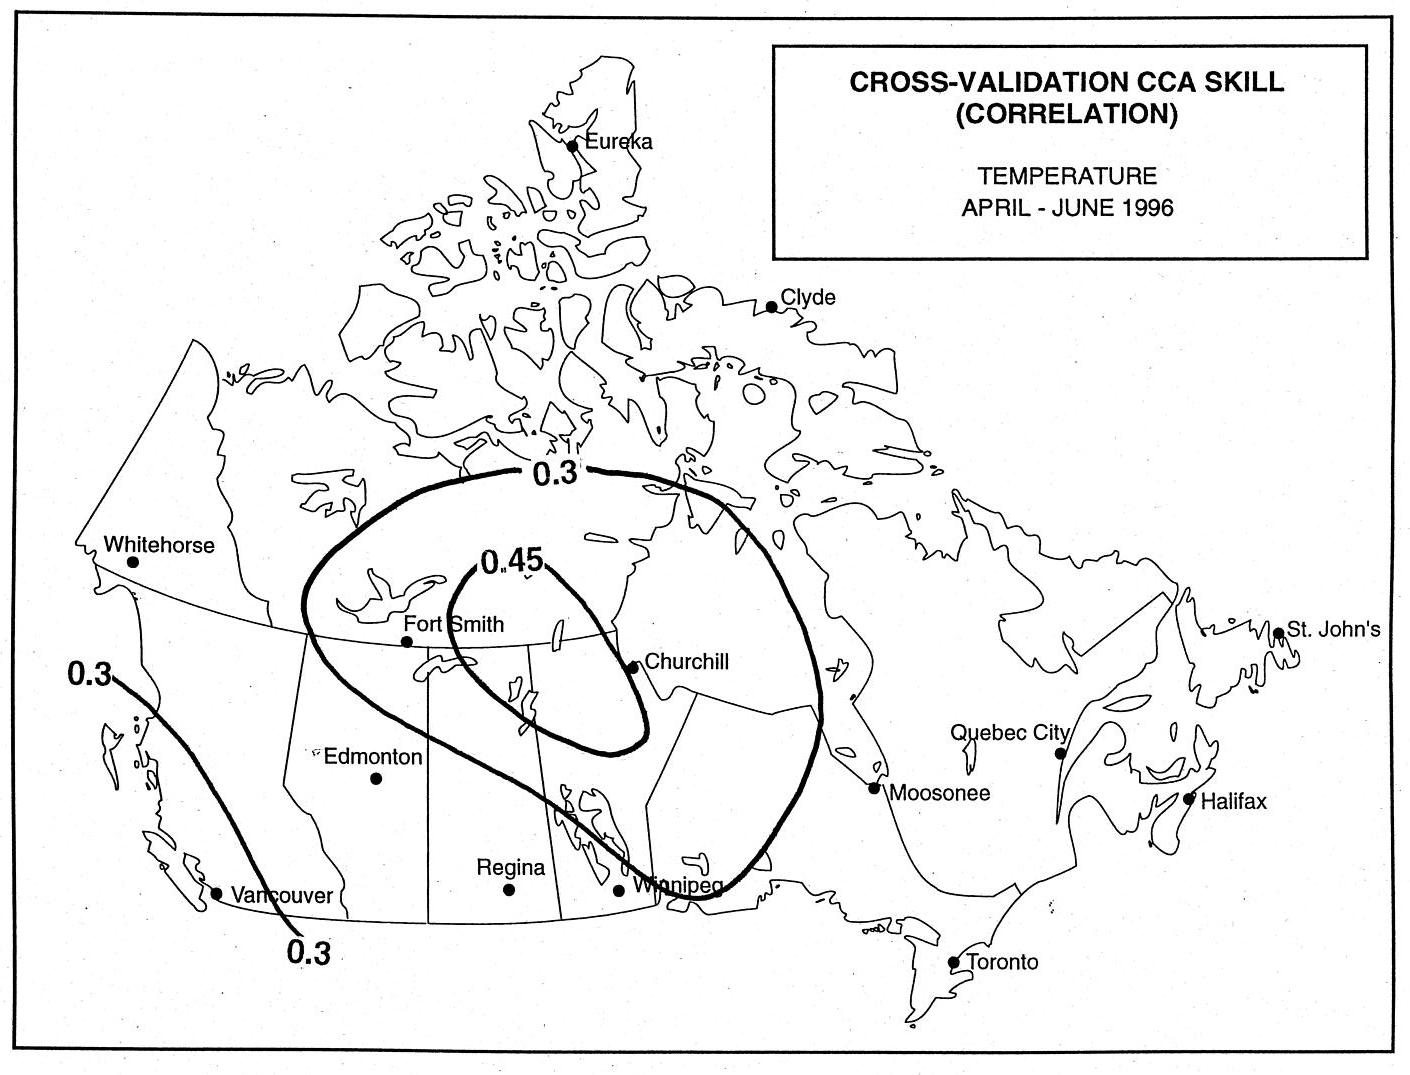
Figure 1. Panel (a, left): CCA-based temperature forecast for the
3 month mean period of Apr-Jun 1996. Forecasts are represented as
standardized anomalies. Panel (b, right): Geographical distribution
of cross-validated historical skill for the forecast shown in (a),
calculated as a temporal correlation coefficient between forecasts
and observations. Areas having forecast skill of 0.30 or higher
are considered to have utility. The mean score over 51 stations is
0.14. Field significance is 0.08.
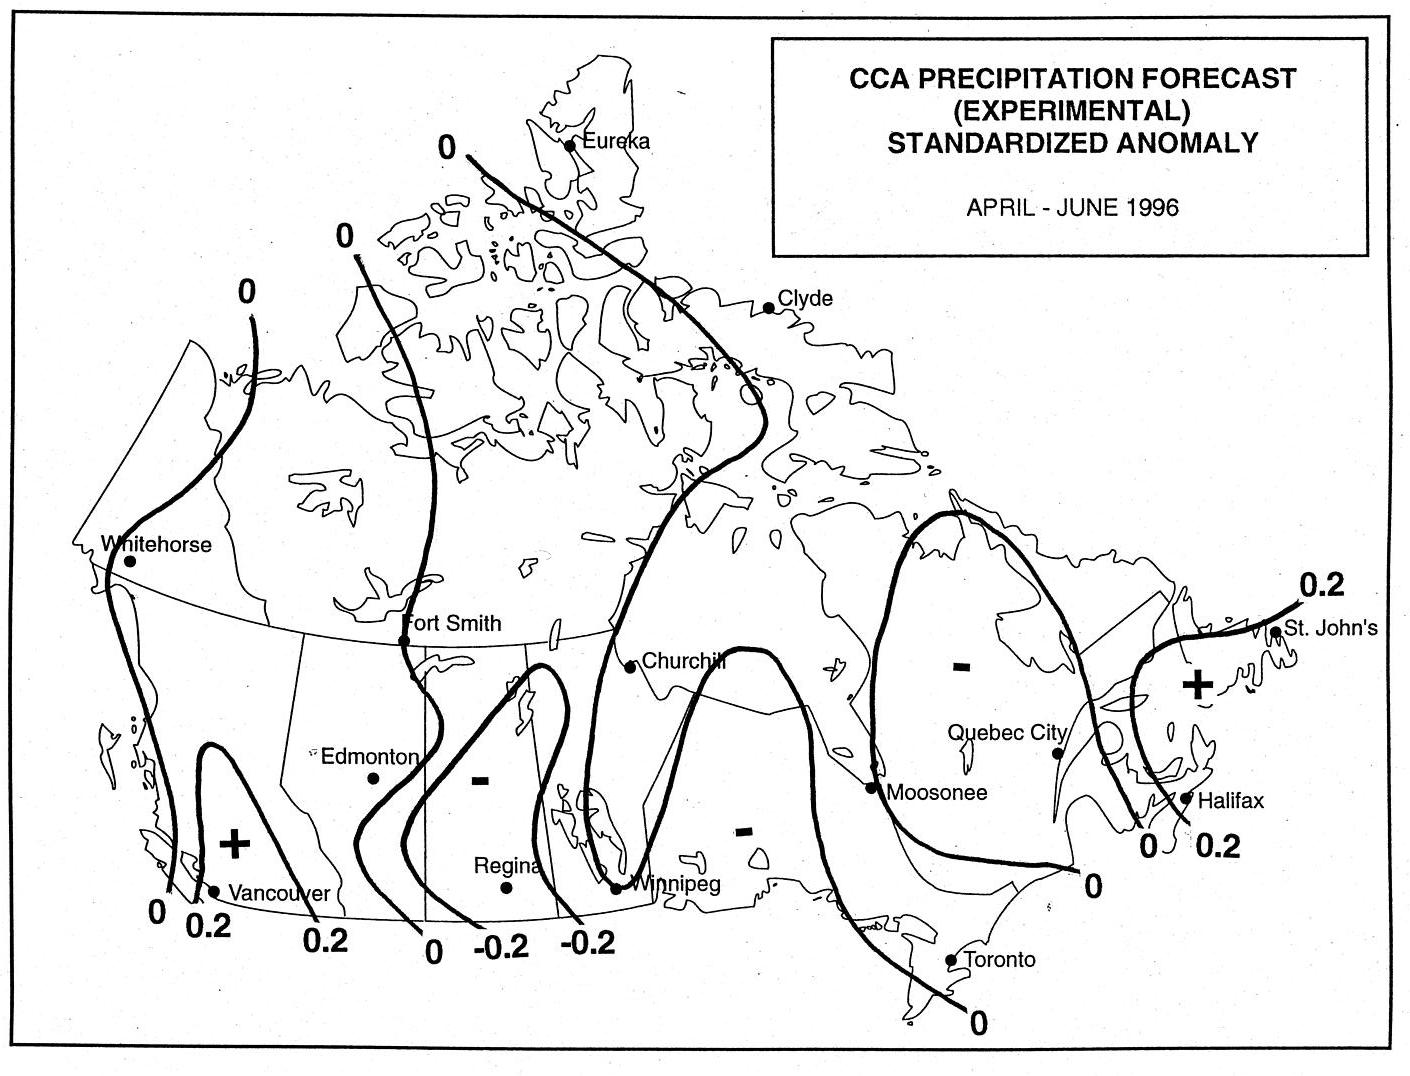
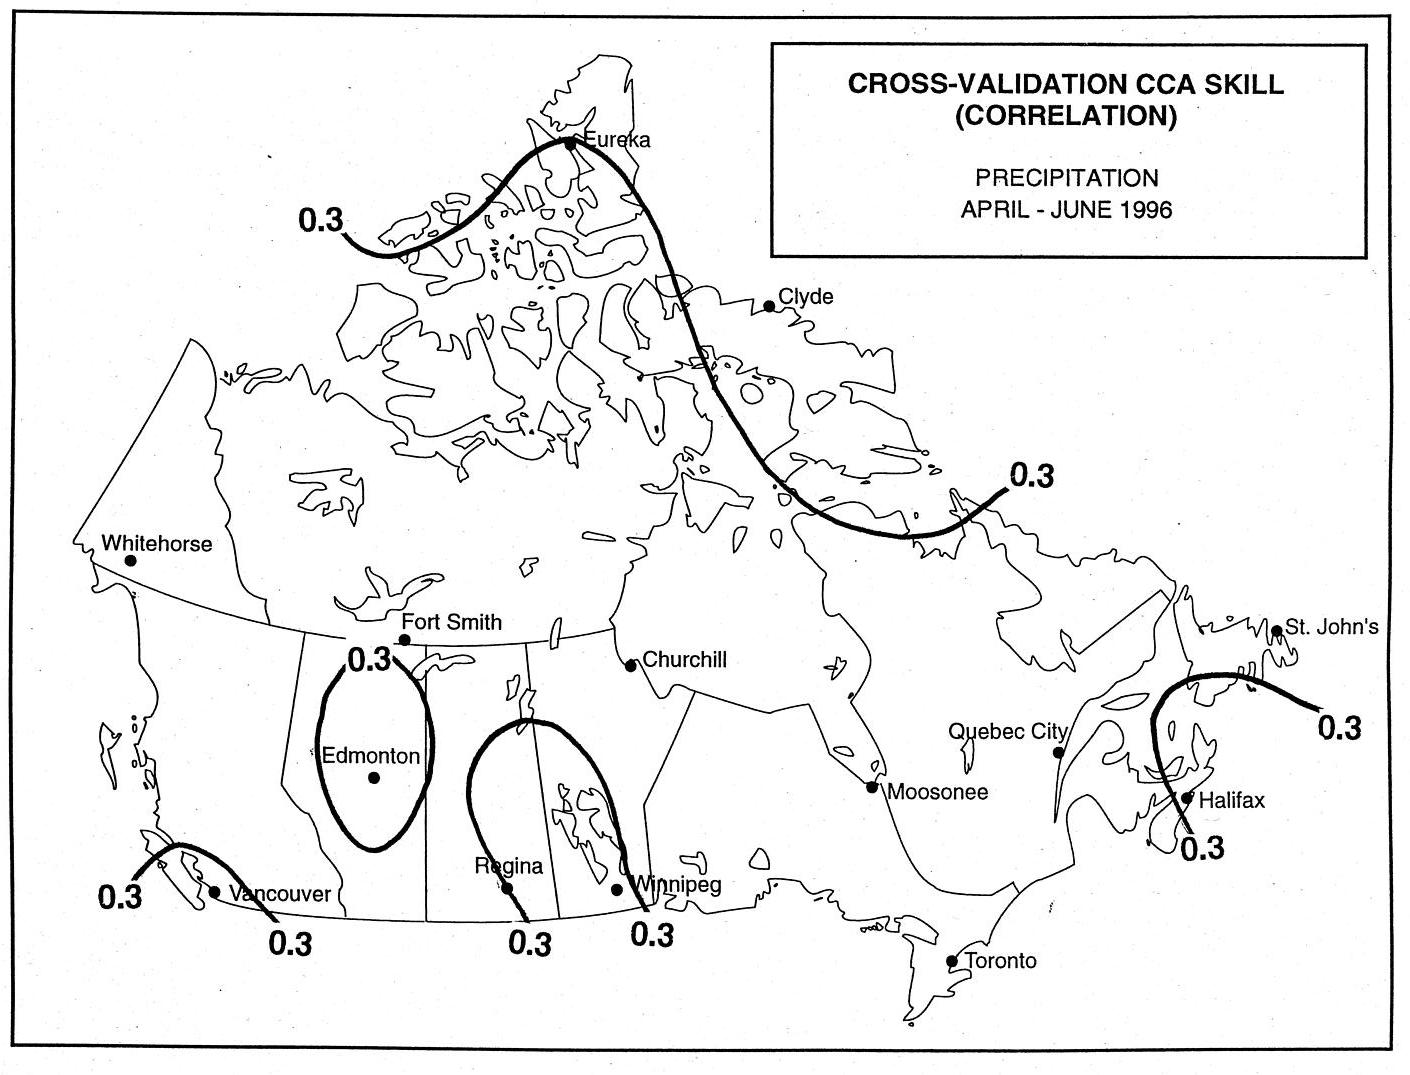
Figure 2. Panel (a, left): As in Figure 1a (CCA anomaly forecast),
except for Apr-Jun 1996 precipitation. Panel (b, right): As in Figure
1b (skill for the forecast shown in [a]), except for precipitation. The
mean score over 69 stations is 0.14. Field significance is 0.05
(see text).
[Purpose] -
[Contents] -
[Editorial Policy] -
[Next Article] -
[Previous Article]