Because of the severity and recurrence of rainfall deficits across the African continent in recent decades, policy makers and funding agencies have faced tough challenges to make relief plans. There clearly is a need for long-lead forecasts of seasonal rainfall anomaly fluctuations. The African Desk, established at the Climate Prediction Center (CPC) of the NWS/NCEP, has been developing African seasonal forecasting capa-bility in collaboration with the CPC. While numerical approaches are being considered, work so far has focused more on statistical methods. Here we apply canonical correlation analysis (CCA) to produce an ex-perimental forecast for rainfall anomalies in southern Africa (10-35S, 10-50E) for the Jan-Feb-Mar 1998 rainy season.
CCA is a multivariate regression that relates patterns in predictor fields to patterns in the predictand field. In the prediction design used here, four consecu-tive 3-month predictor periods are followed by a lead time and then a single 3-month predictand (target) period. Forecast skill experiments indicate that the global SST serves best as a predictor. While other fields might further enhance skill, data sets of these fields for the Tropics and Southern Hemisphere do not extend far enough into the past to provide a long-term history for CCA. The SST and rainfall data sets used here begin in 1955. For this forecast, SST predictor data span the four 3-month periods of SON 1996, DJF, MAM and JJA 1997. Historical relationships between the prior year's SST anomaly evolution and the target year's Jan-Feb-Mar Southern Africa rainfall anomaly patterns are linearly modeled by the CCA. The current year's SSTs are then projected onto these relationships and a forecast for Jan-Feb-Mar 1997 is developed. A lead time of 4 months is used--the time by which the latest predictor data (August) precede the target period onset.
The predictor SST data were derived from a combination of the COADS data and more recent OI data (Smith et al. 1994). The predictand rainfall data come from the Hulme (1994) gridded global rainfall data, providing 58 grid points in the Southern Africa. These rainfall data yield slightly higher skills than those using individual station rainfalls, the latter shown in Thiao et al. (1996) and Barnston et al. (1996).
The CCA diagnostics indicate that expected skill averages 0.23 over southern Africa for the Jan-Feb-Mar precipitation forecast (at 4-months lead) shown below, with highest skill near 0.60 in southeastern Mozam-bique. Cross-validation is used in obtaining the skill estimates, where each year is held out of the devel-opmental data set in turn and used as the forecast target.
While 6 CCA modes are used in this prediction, the leading 2 or 3 modes account for most of the skill. The CCA diagnostics indicate that the global tropical SST anomaly (including the ENSO state) is an import-ant factor. A nearly equally important factor here is the ENSO state itself, as manifested by the tropical Pacific SST anomaly. El Niño tends to be associated with negative rainfall anomalies in most of southern Africa. Thus, the current El Niño is likely to result in suppressed rainfall in most of Southern Africa in JFM.
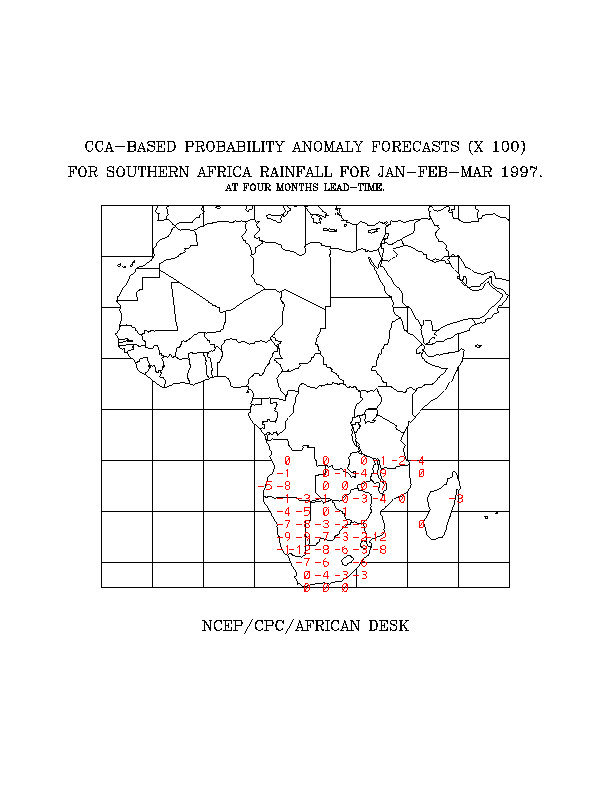
The forecast shown below (Fig. 1) is expressed as probability anomalies with respect to climatological probabilities for three equiprobable categories: below, near, and above normal (B, N, and A, respectively). The climatological probability of each category is 1/3. The predictand grid points are shown by the locations of the numbers on the map. The forecast gives the deviation from these probabilities for Jan-Feb-Mar 1998, with respect to the above normal class. For example, a -0.08 probability anomaly (shown as -8) implies probabilities of (B, N and A) of 0.413, 0.333 and 0.253 compared to climatological probabilities of o.333, 0.333, 0.333. In some cases the probability of the near normal category may be elevated at the expense of the two outer categories. Probabilistic forecasts convey the degree of uncertainty, and assume that the users have some idea of the rainfall amount intervals defined by the bottom, middle and top thirds of the distribution. These thirds may be roughly asso-ciated with drought, normal, or plentiful rainfall cases.
Figure 1 broadly indicates dry conditions for Jan-Feb-Mar 1998 for of southern Africa. Even with only modest to moderate skills at many of the grid points, the strength of the predictor signal for this forecast (the strong ENSO condition) produces a relatively strong tilt of the odds toward dryness over the region. Statistically, ENSO conditions present in August/ September are quite likely to persist through the remainder of the calendar year, implying a continuation of the current tropical Pacific conditions into the rainy season for southern Africa.
Barnston, A.G., W. Thiao and V. Kumar, 1996: Long-lead forecasts of seasonal precipitation in Africa using CCA. Wea. Forecasting, 11, 506-520.
Hulme, M., 1994: Validation of large-scale precipitation fields in general circulation models. In Global Precipitation and Climate Change, M. Desbois and F. Desalmand, Ed., NATO ASI Series, Springer-Verlag, Berlin, 466 pp.
Smith, T.M., R.W. Reynolds, and C.F. Ropelewski, 1994: Optimal averaging of seasonal sea surface temperatures and associated confidence intervals (1860-1989). J. Climate, 7, 949-964.
Thiao, W., A.G. Barnston and V. Kumar, 1996: Teleconnections and seasonal rainfall prediction in Africa. Proceedings of the 20th Annual Climate Diagnostics Workshop, Seattle, Washington, October 23-27, 1995, 413-416.
Fig. 1. The CCA-based rainfall probability anomaly
forecasts for the southern African region for Jan-Feb-Mar 1998, made at
4 months lead. Values shown are deviations (X100) from climatological probabilities
for the above normal category. For example, 3 implies (B,N,A) probabilities
of 0.303, 0.333, 0.363 (a weak tilt toward wetness), while -7 implies 0.403,
0.333, 0.263 (a somewhat stronger tilt toward drought). See text for further
details.