[Previous Article]
[Next Article]
Analogue (NonŁLinear) Forecasts of the Southern Oscillation Index
Time Series
contributed by Wasyl Drosdowsky
Bureau of Meteorology Research Center, Melbourne,
Australia
An analogue selection procedure, based on the nonŁlinear
time series forecasting technique of Sugihara and May (1990), is applied
to the Southern Oscillation Index (Drosdowsky 1994).
The time series to be forecast xi is "embedded"
in an E dimensional space defined by a sequence of lagged coordinates (xt,
xtŁg, x tŁ2g,..., x tŁ(eŁ1)g), where g
is the lag interval, usually taken as one time step. The E+1 closest neighbors
(analogues) to the current state, defined by the vector xt,
x tŁg, x tŁ2g,..., x tŁ(eŁ1)g, are found
and used to construct the smallest simplex containing the current state.
Future states of the system are found by projecting each analogue forward
nT, where n=1,2,..., time steps and taking a suitably weighted average
of the analogues. The optimal embedding dimension E is determined by a
trial and error procedure, using the library of patterns formed by the
first half of the time series to predict the evolution at each point of
the last half of the time series. This effectively determines the window
over which the analogue is selected.
The forecast system has been tested on time series with
known properties. For the SOI, the optimal embedding dimension is found
to be of order 9 to 12. The operational scheme has been used in the monthly
Seasonal Climate Outlook issued by the National Climate Centre of the Australian
Bureau of Meteorology since midŁ1991. Analogues are selected from the entire
available SOI time series from 1876 to the present time. An element of
persistence is included in the forecast by adjusting the weighted analogue
so that the t=0 value agrees with the current observed base value.
The skill of the analogue system has been examined in
hindcast experiments (Drosdowsky 1994), and is shown in Fig. 9-1 in the
September 1994 issue of this Bulletin. For RMSE the one time step forecasts
are approximately equal to persistence while the two or more time step
forecasts are more skillful than persistence within the appropriate range
of embedding dimension. The spread of the analogues during the forecast
period can provide a measure of the confidence level of the forecast.
Beginning with the forecast that appeared in the December
1994 issue, an improved SOI data set has been used. It covers the same
Jan. 1876-present period as before, but periods of missing data have been
filled. Information on the new data set can be obtained from Rob Allan
(rja@dar.csiro.au).
Figure 1 shows the analogue forecast starting from May 1996 and extending through August 1996. The SOI has remained at small positive values over the past three months. The spread of the analogs over both the selection period (September to May) and the forecast period (June to August) has increased over the past three months. This is a result of the Apredictability barrier@ and the currently weak ENSO signal. Forecast values for the next three months (in SD units X 10) are:
| June 1996 |
2.6 |
| July 1996 |
6.6 |
| August 1996 |
6.5 |
Verification of the previous 3 months= forecasts:
| March 1996 | F= 3.2 | V= 6.2 |
| April 1996 | F= -1.7 | V= 7.8 |
| May 1996 | F= -5.4 | V= 1.3 |
The forecast issued in early March failed to predict the
maintenance of positive SOI, although forecasts based on March and April
data (as discussed below) are performing better.
Figure 2 shows the analogue forecast starting from April
1996 (one month earlier than for Fig. 1), and Fig. 3 starting from March
1996. While the forecasts from these three start times are somewhat similar
(in fact, some of the same years are seen to have been selected for all
three starting months), short-term forecasts for a falling SOI has tended
to change to one of a rising SOI as the observed starting point has decreased
from what it was in March. The forecasts beginning from March and May have
considerable internal spread among the five best picks. The verifications
of the two previous months' forecasts (Figs. 2, 3) are good.
Drosdowsky, W., 1994: Analogue (nonŁlinear) forecasts
of the Southern Oscillation Index time series. Wea. Forecasting,
9, 78Ł84.
Sugihara, G. and R.M. May, 1990: Nonlinear forecasting
as a way of distinguishing chaos from mea-surement error in time series.
Nature, 344, 734Ł741.
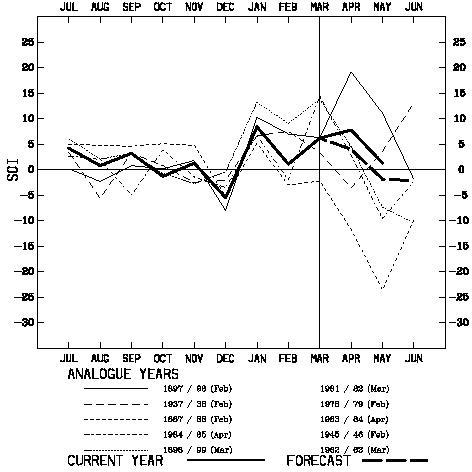
Fig. 1. Selected analogues and forecasts based
on the SOI up to May 1996. Points corresponding to the April, May or June
initial condition have been used for selecting possible analogues. For
clarity, only the best five analogues are plotted (light dashed or dotted
lines), labeled with the year and month corresponding to the current month.
(The remaining five analogues are listed to the right.) Heavy solid and
dashed curves show the current and forecast values.
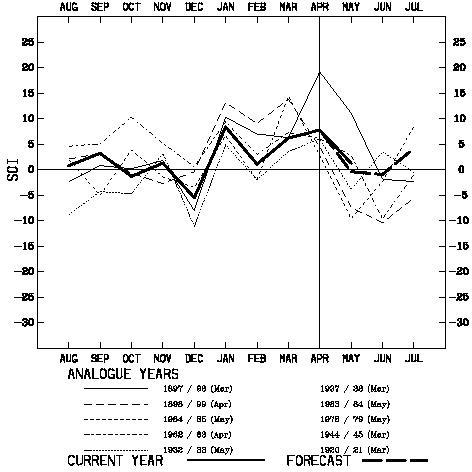
Fig. 2. As in Fig. 1, except based on the SOI
up to April 1996. The verifying value for May is indicated.
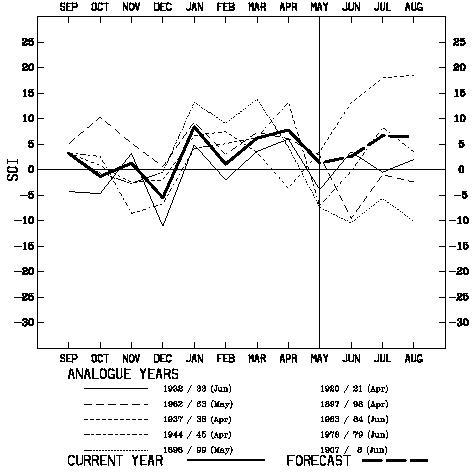
Fig. 3. As in Fig. 1, except based on the SOI
up to March 1995. The verifying values for April and May are indicated.