[Previous Article]
[Next Article]
Forecasts of NiZo 3 SST Anomalies and SOI Based on Singular
Spectrum Analysis Combined with the Maximum
Entropy Method
Ning Jiang, Michael Ghil and J. David Neelin
Department of Atmospheric Sciences and Institute of Geophysics and Planetary Physics
University of California, Los Angeles, California
Singular spectrum analysis (SSA: Vautard and Ghil 1989;
Ghil and Vautard 1991; Plaut et al. 1995) and the maximum entropy method
(MEM: Burg 1968; Penland et al. 1991) are used here for longŁlead forecasts
of the seaŁsurface temperature (SST) anomalies averaged over the NiZo 3
area and the Southern Oscillation Index (SOI). The forecast is for up to
one year ahead, based on the last 45 years of observed data. More detailed
information on the forecast method based on singleŁchannel SSA combined
with MEM is given by Keppenne and Ghil (1992), while multiŁchannel SSA
(MŁSSA: Kimoto et al. 1991; Keppenne and Ghil 1993; Plaut and Vautard 1994)
combined with MEM is documented in the March 1995 issue of this Bulletin
(Jiang et al. 1995). Briefly, the time series is filtered first by SSA
(if univariate) or MŁSSA (if multivariate), so that the statistically significant
components are retained, specifically the quasiquadren-nial (QQ) and the
quasiŁbiennial (QB) components of ENSO variability (Rasmusson et al. 1990;
Keppenne and Ghil 1992; Jiang et al. 1995). Then MEM is applied to advance
these components in time.
Figure 1 shows areaŁaveraged NiZo 3 SSTAs, forecast and
observed, since 1990, using the SSA- and MSSAŁMEM schemes for a 3Ł, 6Ł,
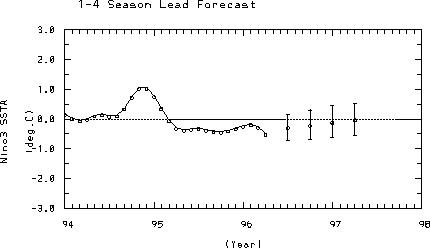
9Ł and 12Łmonth lead. The last forecast, for the next 1-4 seasons, using
data through April 1996, is shown in Fig. 2. The vertical bars are one
standard deviation in length, based on forecast verification over the 1984-93
time span. The forecasts indicate that the presently cooler than normal
conditions in NiZo 3 will gradually return toward normal through early
1997.
Figure 3 shows the SSAŁMEM forecast for the SOI from May
1996 through April 1997. The SOI is expected to remain close to its mean,
but above it, over the remainder of this year. The present SOI forecast
thus agrees with the NiZo 3 SSTA forecast; this was not the case for our
last two quarterly forecasts. The time evolution during a 12Łyear period
(from 1984 to 1995) of the forecast skill of our SSAŁMEM SSTA prediction
and of the correlation between NiZoŁ3 SSTA and SOI show a modest correlation
(Figure 4): a high forecast skill tends to correspond to a high (anti)correlation
between these two ENSO signals (NiZoŁ3 SSTA and SOI). This suggests a Arecovery@
of ENSO from its relatively unpre-dictable state over the last few years
or so, and better prospects for our current forecast.
References
Burg, J.P., 1968: Maximum entropy spectral analysis.
Modern Spectrum Analysis, 34-48. IEEE Press.
Ghil, M. and R. Vautard, 1991: Interdecadal oscillations
and the warming trend in global temperature time series. Nature,
350, 324-327.
Jiang, N., D. Neelin and M. Ghil, 1995: QuasiŁquadrennial
and quasiŁbiennial variability in the equatorial Pacific. Clim. Dyn.,
12, 101-112.
Jiang, N., M. Ghil and D. Neelin, 1995: Forecasts of Equatorial
Pacific SST anomalies using an autoregressive process using singular spectrum
analysis. Experimental Long-Lead Forecast Bulletin, 4, 1,
24-27.
Keppenne, C.L. and M. Ghil, 1992: Adaptive filtering and
prediction of the Southern Oscillation Index. J. Geophys. Res.,
97: 20449-20454.
Keppenne, C.L. and M. Ghil, 1993: Adaptive filtering and
prediction of noisy multivariate signals Adaptive filtering and prediction
of noisy multivariate signals: An application to subannual variability
in atmospheric angular momentum. Intl. J. Bif. & Chaos, 3,
625Ł634.
Kimoto, M., M. Ghil and K.C. Mo, 1991: Spatial structure
of the 40Łday oscillation in the Northern Hemisphere extratropics. Proc.
8th Conf. Atmos. & Oceanic Waves & Stability. Amer. Met. Soc.,
Boston, 115Ł116.
Penland, C., M. Ghil and K.M. Weickmann, 1991: Adaptive
filtering and maximum entropy spectra, with application to changes in atmospheric
angular momentum. J. Geophys. Res., 96, 22,659-22,671.
Plaut, G.R. and R. Vautard, 1994: Spells of oscillations
and weather regimes in the low-frequency dynamics of the Northern Hemisphere.
J. Atmos. Sci., 51, 210-236.
Plaut, G.R., M. Ghil and R. Vautard, 1995: Interannual
and interdecadal variability in 335 years of central England temperature.
Science, 268, 710-713.
Rasmusson E.M., X. Wang and C. F. Ropelewski, 1990: The
biennial component of ENSO variability. J. Mar. Sys., 1,
71-96.
Vautard, R., and M. Ghil, 1989: Singular spectrum analysis
in nonlinear dynamics with applications to paleoclimatic time series. Physica
D, 35, 395-424.
Fig. 1. Forecasts of the areaŁaveraged NiZoŁ3
SST anomalies (SSTA) by the SSAŁMEM (star) and MSSAŁMEM (circle) schemes.
The solid line indicates the observed NiZoŁ3 SSTA. The latest forecast
starts from April 1996. Shown for: (a) 3Łmonth, (b) 6Łmonth, (c) 9Łmonth
and (d) 12Łmonth lead.
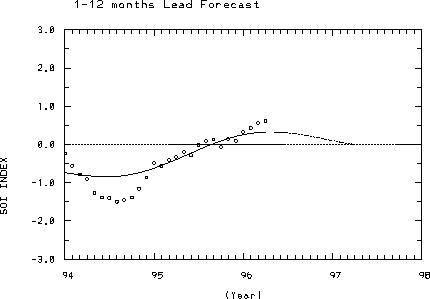
Fig. 2. The forecasts of the NiZoŁ3 SSTA for the
upcoming 4 seasons using the SSAŁMEM scheme. The solid line indicates the
observed NiZoŁ3 SSTA.
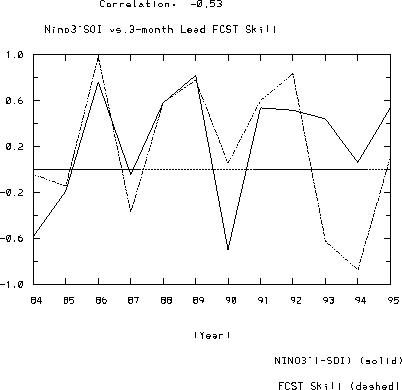
Fig. 3. SSAŁMEM forecast of the SOI for May 1996
through April 1997. The circles are the monthly SOI values based on a 5Łmonth
running mean without the seasonal cycle and the solid line is the SSAŁfiltered
SOI. The dashed line indicates the forecast for the next 12 months.
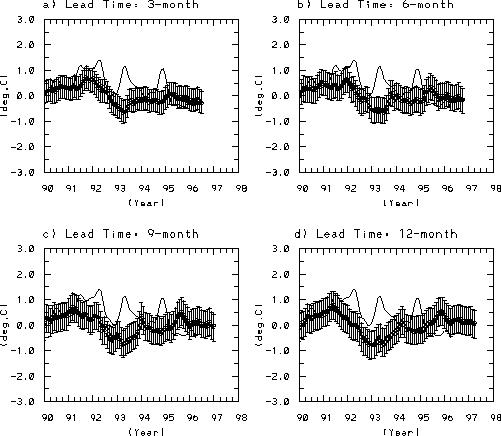
Fig. 4. The correlation between the NiZoŁ3 SSTA
and (ŁSOI) (solid line), and the forecast skill of SSTA using the SSAŁMEM
scheme for 3Łmonth lead forecasts (dashed line) during 1984Ł1995. Both
the correlation and the forecast skill are calculated for nonoverlapping
oneŁyear intervals (from January to December), where the means over the
12 months are removed in calculating the correlation (i.e. it is a standard
correlation coefficient).