[Previous Article]
[Next Article]
Complex Singular Spectrum Analysis
and Multivariate Adaptive Regression Splines
Applied to Forecasting the Southern Oscillation
Christian Keppenne1 and Upmanu Lall2
1clk@jpl.nasa.gov http://yabloko.jpl.nasa.gov/clk.html
2ulall@kernel.uwrl.usu.edu http://grumpy.usu.edu/~FALALL/ulall.html
1Jet Propulsion Laboratory, Pasadena, California 91109
2Utah Water Research Laboratory,
Utah State University, Logan, Utah 84322
A few years ago, Keppenne and Ghil (1992a,b; see also
issues of this Bulletin before December 1995) introduced a methodology
to forecast the Southern Oscillation Index (SOI) by applying the maximum
entropy method (MEM) to produce autoregressive forecasts of a set of adaptively
filtered time series resulting from the application of singular spectrum
analysis (SSA) to the raw monthly mean SOI. The success of this methodology
has led to the development of a multivariate prediction scheme based on
the same concepts, but with the substitution of multivariate SSA for univariate
SSA (Keppenne and Ghil 1993, Jiang et al. 1995). The technique used now
contains improvements to the linear prediction scheme used to issue the
SSA/MEM predictions presented previously.
First, the data base used to compute the forecasts now
extends backward to 1881, thanks to our new variation of SSA capable of
handling the occasional missing values. Most data adaptive statistical
prediction methods are best understood in terms of an Aanalog forecast@
(e.g. Toth 1991, Huang et al. 1993, Livezey et al. 1994). Thus, the extension
of the data base increases the likelihood of identifying a suitable Aanalog@
that help determine the forecast=s basis functions. This process forecasts
the real and imaginary parts of the SOI=s leading four complex principal
components (CPCs) using a variation of multivariate adaptive regression
splines (MARS: Friedman 1991, Lewis and Stevens 1991, Lall et al. 1996),
a nonlinear dataşadaptive statistical method.
Second, in contrast with our earlier work (Keppenne and
Ghil 1992a,b) in which SSA was applied to the difference between the Tahiti
and Darwin normalized SLP time series, we apply CSSA to the complex time
series whose real and imaginary parts consist in the Darwin and Tahiti
SLP, forecast the real and imaginary parts of the resulting CPCs separately,
and then take their differences to construct a forecast for the filtered
SOI. This procedural modification enhances the forecast skill, because
taking the difference between two separately CSSA-filtered time series
increases the noiseştoşsignal ratio.
Third, we have replaced the linear autoregressive MEM
system by the skill-preserving, analog-like nonlinear MARS methodology.
MARS has advantages discussed in earlier issues of this Bulletin. In our
variation of MARS, appropriate Aneighbors@ of the prevailing climate conditions
are identified in the phase space; regressionşsplines are then used to
develop the predictions. More detail about this procedure is provided in
Keppenne and Lall (1995, 1996).
The evaluation of the algorithm=s forecast skill uses
a Aretroactive real-time@ simulation in which only forward-looking hindcasts
are developed. As detailed in the December 1995 and March 1996 issues of
this Bulletin, the MARS model dramatically outperforms the MEM models at
leads of less than 2.5 years.
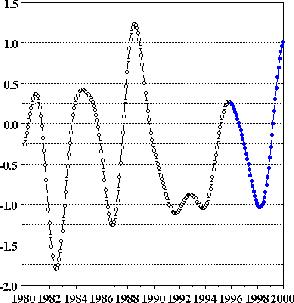
The latest CSSA-MARS forecast is shown in Fig. 1. The CSSAşfiltered SOI appears to have peaked and the MARS models applied to the corresponding complex principal components predict a return to normal conditions followed by an El Nino in mid-1998. This differs somewhat from the forecast issued 3 months ago in that further strengthening of the La Nina conditions into 1997 is no longer forecast. This forecast change is in good continuity with that noted from December 1995 to March 1996.
References
Friedman, J.H., 1991: Multivariate adaptive regression
splines. Ann Stat, 19, 1ş50.
Huang, J.P., Y.H. Yi, S.W. Wang and J.F. Chou, 1993: An
analogşdynamic longşrange numerical weather prediction system incorporating
historical evolution. Q J R Met. Soc., 119, 547ş565.
Jiang, N., M. Ghil and D. Neelin, 1995: Forecasts of equatorial
Pacific SST using an autoregressive process using singular spectrum analysis.
Exp. LongşLead Forcst. Bull., 4, No. 1, 24ş27.
Keppenne, C.L. and M. Ghil, 1992a: Forecasting extreme
weather events. Nature, 358, 547.
Keppenne, C.L. and M. Ghil, 1992b: Adaptive Spectral Analysis
and Prediction of the Southern Oscillation Index. J. Geophys. Res.,
97, 20449ş20554.
Keppenne, C.L. and M. Ghil, 1993: Adaptive filtering and
prediction of noisy multişvariate signals: an application to atmospheric
angular momentum. Intl. J. Bifurcations and Chaos, 3, 625ş634.
Keppenne, C.L. and U. Lall, 1995: A new methodology to
forecast paleoclimate time series with application to the Southern Oscillation
index. EOS Trans AGU. 1995 Fall Meeting Supplement, 76, F327.
Keppenne, C.L. and U. Lall, 1996: Complex singular spectrum
analysis and multivariate adaptive regression splines applied to forecasting
the Southern Oscillation. J. Clim., 9, submitted.
Lall, U., T. Sangoyomi and H.D. Abarbanel, 1996: Nonlinear
dynamics of the Great Salt Lake: nonparametric short term forecasting.
Water Resources Res., in press.
Lewis, P.A.W. and J.G. Stevens, 1991: Nonlinear modeling
of time series using multivariate adaptive regression splines (MARS). J.
Amer. Stat. Assoc., 86, 864ş877.
Livezey, R.E., A.G. Barnston, G.V. Gruza and E.Y. Rankova,
1994: Comparative skill of 2 analog seasonal temperature prediction systems:
Objective selection of predictors. J. Clim., 7, 608ş615.
Toth, Z., 1991: Estimation of atmospheric predictability
by circulation analogs. Mon. Wea. Rev., 119, 65ş72.
Fig. 1. Adaptively filtered Southern Oscillation
Index (SOI) time series resulting from the complex singular spectrum analysis
(CSSA) of the monthly mean Darwin and Tahiti seaşlevel pressure (SLP) data
through May 1996 (unfilled circles). The application of a variant of multivariate
adaptive regression splines (MARS) to the real and imaginary parts of the
leading four complex principal components (CPCs) resulting from the CSSA
yields the forecast (filled circles on right side of curve).