[Previous Article]
[Next Article]
Experimental Canonical Correlation Analysis (CCA) Forecasts
of Canadian Temperature and Precipitation şş
Jul-Aug-Sep 1996
Contributed by Amir Shabbar
Climate Research Branch, Atmospheric Environment Service, Downsview, Ontario, Canada
ashabbar@ccrdp03.dow.on.doe.ca
In the last two issues of this Bulletin, forecasts of
Canadian temperature and precipitation using the multivariate statistical
technique of canonical correlation analysis (CCA) were presented. For Canada,
we have developed the predictive relationships between evolving large scale
patterns of quasişglobal sea surface temperature, Northern Hemisphere 500
mb circulation, and the subsequent Canadian surface temperature and precipitation.
In this issue we present the forecasts for Jul-Aug-Sep 1996 using the predictor
fields through May 1996. These forecasts are made with a lead time of 4
months, where lead time is defined as the time between the end of the latest
predictor season and the end of the predictand season. Further detail about
the Canadian CCAşbased seasonal climate prediction is found in Shabbar
(1996a, 1996b) and Shabbar and Barnston (1996).
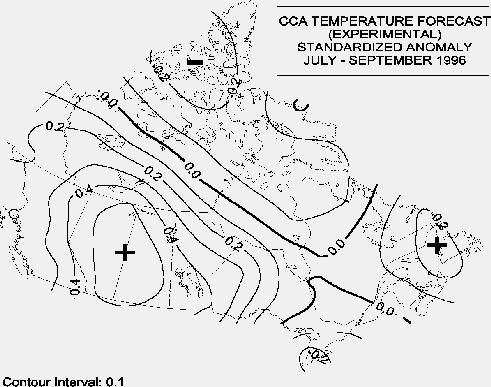
Figure 1 shows the CCAşbased temperature forecast for
the 3 month period of Jul-Aug-Sep 1996 expressed as standardized anomaly.
Table 1 shows the value of the standard deviation in EC at selected stations.
The mean skill over all 51 stations is given in the caption beneath each
forecast map. The field significance is also shown, reflecting the probability
of randomly obtaining overall map skill equal to or higher than that which
actually occurred. Field significance is evaluated using a Monte Carlo
procedure in which the forecast versus observation correspondences are
shuffled randomly 1000 times. The field of crossşvalidated historical skill
(correlation) for the forecast time period is shown in Figure 2. The forecast
has a rather limited utility in terms of expected skill, with a mean national
score of 0.12. The skill map could not be distinguished from a randomly
generated skill map at the 5% level of significance. The skill of the temperature
forecast is low during summer in Canada (see the September 1995 issue of
this Bulletin, page 28). Locally, modest skills are found over the Great
Lakes region and over an area just west of Hudson Bay. Southeastern Ontario
and much of arctic Canada are expected to be slightly below normal, whereas
temperatures are forecast to be above normal over most of western and south-central
Canada.
Figure 3 shows the CCAşbased precipitation forecast for
the 3 month period of Jul-Aug-Sep 1996 expressed as a standardized anomaly.
Table 1 shows the value of the standard deviation (mm) at selected stations.
Crossşvalidated historical skill (correlation) for this time period is
shown in Figure 4. The forecast has modest expected skill: a mean national
score of 0.10. As with temperature, the skill map does not attain field
significance at the 5% level. Local skills are highest over sections of
northern Quebec and the western Arctic. The only region showing a spatially
extensive anomaly with skill of at least 0.3 is in the Arctic, where an
excess of Jul-Aug-Sep precipitation is predicted.
No particularly strong signals are influencing this forecast.
Even if the ENSO state were more strongly defined, ENSO is not known to
appreciably affect Canadian climate in summer as it is from winter through
mid-spring. A gradual historical cooling trend in the north Pacific over
the last 15 years would imply a deeper than normal low pressure gyre in
the northeastern Pacific and an amplified western Canadian ridge, which
would produce warmer than normal temperatures in western Canada.
Table 1. Standard deviation of temperature (Temp) and
precipitation (Prcp) for the 3 month period July through September at selected
Canadian stations.
| Temperature | Precipitation | |
| Station |
(oC) |
(mm) |
| Whitehorse |
1.3 |
19.2 |
| Fort Smith |
1.5 |
23.9 |
| Innujjuak |
1.2 |
23.1 |
| Eureka |
1.5 |
9.9 |
| Vancouver |
0.0 |
30.2 |
| Edmonton |
1.7 |
34.0 |
| Regina |
1.7 |
30.9 |
| Winnipeg |
1.7 |
40.8 |
| Churchill |
1.4 |
24.1 |
| Moosonee |
1.5 |
33.2 |
| Toronto |
1.4 |
35.1 |
| Quebec City |
1.3 |
45.2 |
| Halifax |
1.0 |
56.6 |
| St. John's |
1.3 |
48.5 |
Caveat: This is an experimental product. The Official
Environment Canada seasonal forecast can be obtained from the Canadian
Meteorological Centre in Montreal.
References
Shabbar, A., 1996a: Seasonal prediction of Canadian surface
temperature and precipitation by canonical correlation analysis. Proceedings
of the 20th Annual Climate Diagnostics Workshop, Seattle, Washington,
October 23-27, 1995, 421-424.
Shabbar, A., 1996b: Seasonal forecast of Canadian surface
temperature by canonical correlation analysis. 13th Conference on Probability
and Statistics in the Atmospheric Sciences. American Meteorological
Society, San Francisco, California, February 21-23, 339-342.
Shabbar, A. and A.G. Barnston, 1996: Prediction of Canadian
seasonal temperature and precipitation using canonical correlation analysis.
Mon. Wea. Rev., 124, in press.
Fig. 1. CCAşbased temperature forecast for the
3 month mean period of Jul-Aug-Sep 1996. Forecasts are represented as standardized
anomalies.
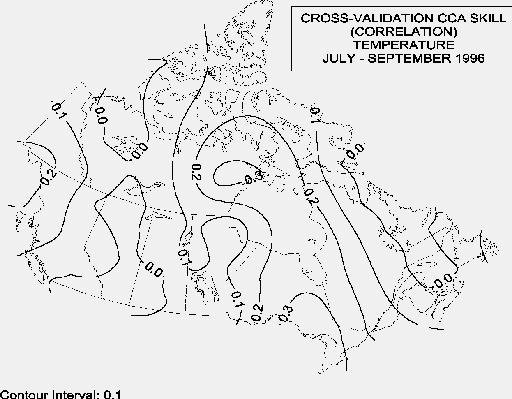
Fig. 2. Geographical distribution of crossşvalidated
historical skill for the forecast shown in Fig. 1, calculated as a temporal
correlation coefficient between forecasts and observations. Areas having
forecast skill of 0.30 or higher are considered to have utility. The mean
score over 51 stations is 0.12. Field significance is 0.16.
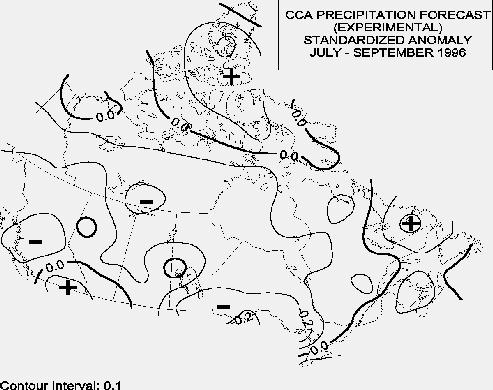
Fig. 3. As in Fig. 1 (CCA anomaly forecast), except
for Jul-Aug-Sep 1996 precipitation.
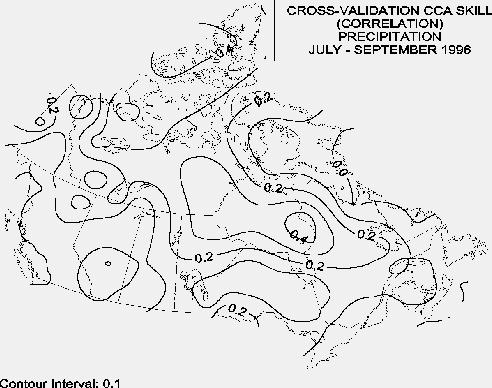
Fig. 4. As in Fig. 2 (geographic skill distribution)
except for the precipitation forecast shown in Fig. 2. The mean score over
69 stations is 0.10. Field significance is 0.40 (see text).