Skip Navigation Links www.nws.noaa.gov 
NOAA logo - Click to go to the NOAA home page National Weather Service   NWS logo - Click to go to the NWS home page
Climate Prediction Center

 
HOME > Expert Assessments > Climate Diagnostics Bulletin  
 

figure e6

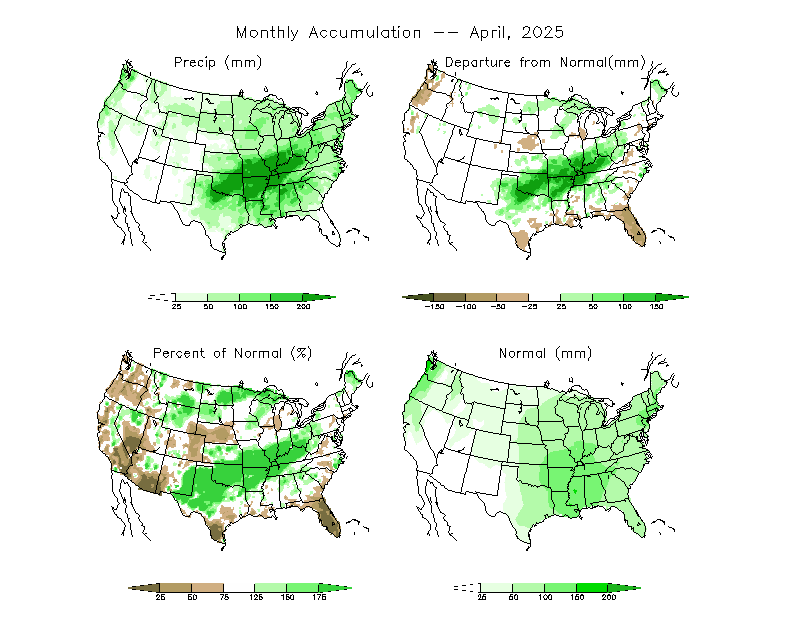
FIGURE E6. Observed precipitation (upper left), departure from average (upper right), percent of average (lower left), and average precipitation (lower right). The units are given on each panel. Base period for averages is 1981-2010. Results are based on CPC’s U. S. daily precipitation analysis, which is available at http://www.cpc.ncep.noaa.gov/products/precip/realtime/.


NOAA/ National Weather Service
NOAA Center for Weather and Climate Prediction
Climate Prediction Center
5830 University Research Court
College Park, Maryland 20740
Page Author: Climate Prediction Center Internet Team
Page last modified: August 16, 2007
Disclaimer
Information Quality
Credits
Glossary
Privacy Policy
Freedom of Information Act (FOIA)
About Us
Career Opportunities