This 2020 Atlantic hurricane season outlook is an official product of the National Oceanic and Atmospheric Administration (NOAA) Climate Prediction Center (CPC). The outlook is produced in collaboration with hurricane experts from the National Hurricane Center (NHC) and the Hurricane Research Division (HRD). The Atlantic hurricane region includes the North Atlantic Ocean, Caribbean Sea, and Gulf of Mexico.
Interpretation of NOAA's Atlantic hurricane season outlook:
This outlook is a general guide to the expected overall activity during the upcoming hurricane season. It is not a seasonal hurricane landfall forecast, and it does not predict levels of activity for any particular location.
Preparedness:
Hurricane-related disasters can occur whether the season is active or relatively quiet. It only takes one hurricane (or tropical storm) to cause a disaster. It is crucial that residents, businesses, and government agencies of coastal and near-coastal regions prepare for every hurricane season regardless of this, or any other, seasonal outlook. The Federal Emergency Management Agency (FEMA), the National Hurricane Center (NHC), the Small Business Administration, and the American Red Cross all provide important hurricane preparedness information on their web sites.
NOAA does not make seasonal hurricane landfall predictions:
NOAA does not make seasonal hurricane landfall predictions. Hurricane landfalls are largely determined by the weather patterns in place as the hurricane approaches, and those patterns are only predictable when the storm is within several days of making landfall.
Nature of this outlook and the "likely" ranges of activity:
This outlook is probabilistic, meaning the stated "likely" ranges of activity have a certain likelihood of occurring. The seasonal activity is expected to fall within these ranges in 7 out of 10 seasons with similar climate conditions and uncertainties to those expected this year. They do not represent the total possible ranges of activity seen in past similar years.
This outlook is based on 1) predictions of large-scale climate factors known to influence seasonal hurricane activity, and 2) climate models that directly predict seasonal hurricane activity.
Sources of uncertainty in the seasonal outlooks:
Will La Niña develop and reinforce the conditions that are already conducive for tropical cyclone development across the Atlantic Main Development Region (MDR)? Predicting El Niño and La Niña (also called the El Niño-Southern Oscillation, or ENSO) impacts is an ongoing scientific challenge facing climate scientists today. Such forecasts often have limited skill, especially when border-line El Niño or La Niña events are predicted. Many combinations of named storms and hurricanes can occur for the same general set of climate conditions. For example, one cannot know with certainty whether a given climate signal will be associated with several shorter-lived storms or fewer longer-lived storms with greater intensity. Model predictions of sea surface temperatures, vertical wind shear, moisture, and stability are still showing some spread for the peak months (August-October) of the hurricane season, and it is unclear as to exactly how conducive these conditions will be for tropical cyclone development during ASO 2020. Weather patterns that are unpredictable on seasonal time scales can sometimes develop and last for weeks or months, possibly affecting seasonal hurricane activity.
2020 Atlantic Hurricane Season Outlook: Summary
a. Predicted Activity
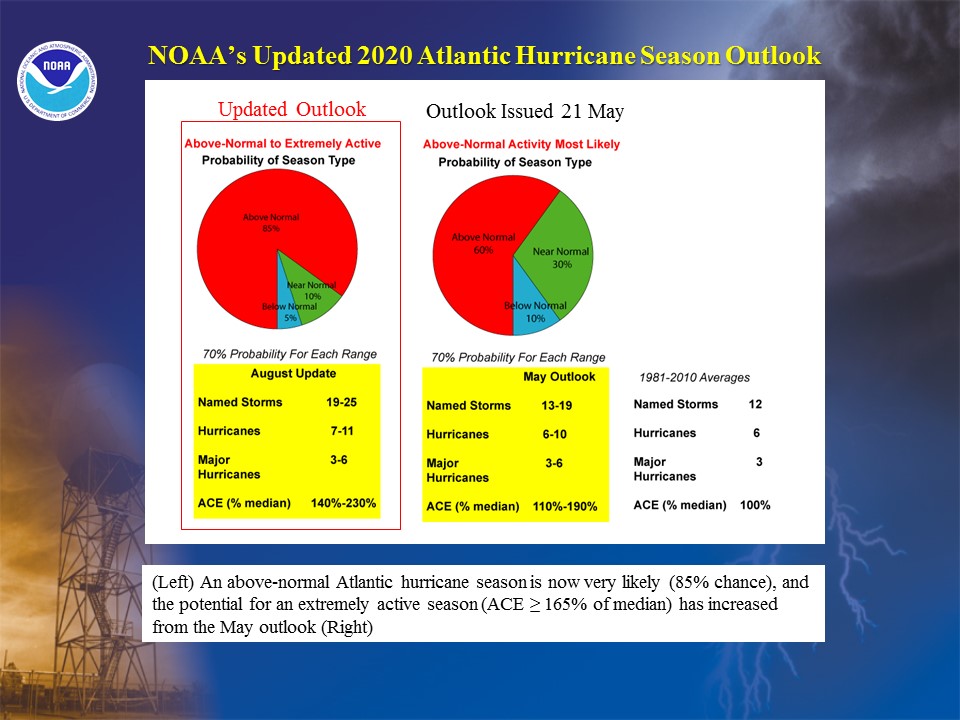
NOAA's updated 2020 Atlantic Hurricane Season Outlook indicates that an above-normal hurricane season is very likely, with a significant possibility of the season being extremely active. The outlook indicates an 85% chance of an above-normal season, only a 10% chance of a near-normal season, and a nominal 5% chance of a below-normal season. See NOAA definitions.The Atlantic hurricane region includes the North Atlantic Ocean, Caribbean Sea, and Gulf of Mexico.
This updated outlook calls for a 70% probability for each of the following ranges of activity during the 2020 hurricane season, which officially runs from June 1st through November 30th:
- 19-25 Named Storms, which includes the nine recorded named storms during May-July
- 7-11 Hurricanes, which includes two hurricanes to date
- 3-6 Major Hurricanes
- Accumulated Cyclone Energy (ACE) range of 140%-230% of the median, which includes the ACE from the nine named storms to date.
The activity is expected to fall within these ranges in 70% of seasons with similar climate conditions and uncertainties to those expected this year. These ranges do not represent the total possible activity seen in past similar years.
The season is now expected to be one of the more active in the historical record. The centers of the predicted ranges of named storms, hurricanes, and major hurricanes (22, 9, and 4.5, respectively) are well above the 1981-2010 seasonal averages of about 12 named storms, 6 hurricanes, and 3 major hurricanes.
The biggest changes from the May outlook are: 1) The likelihood of an above-normal season has increased (85% now compared to 60% in May), and an extremely active season is even more likely; 2) The likely number of named storms has increased sharply (19-25 now compared to 13-19 in May); and 3) We could also see more hurricanes (7-11 now compared to 6-10 in May).
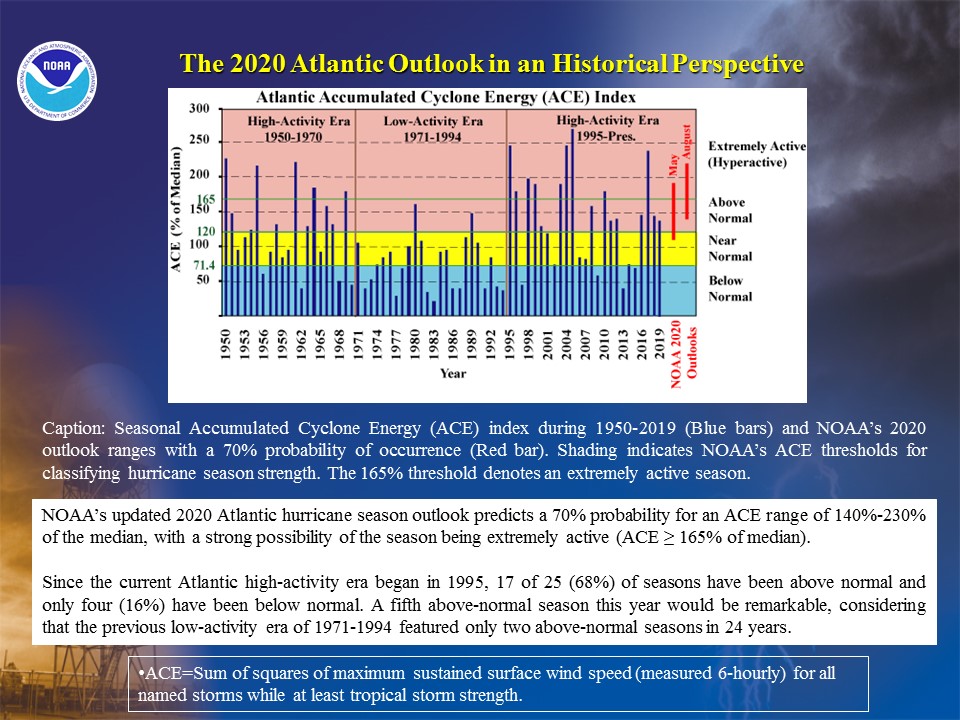
The ACE index measures the combined intensity and duration of all tropical storms and hurricanes during the season. NOAA uses this robust measure of overall seasonal activity to help classify hurricane season strength. The entire predicted ACE range for 2020 is now above NOAA's lower threshold (120% of median) for an above-normal season, and the center of that range (185% of median) is now above NOAA's lower threshold (165% of median) for an extremely active season.
The predicted 2020 activity reflects a continuation of the Atlantic high-activity era that began in 1995. Since 1995, 17 of 25 (68%) seasons have been above normal (not counting 2020) and nine have been extremely active. 2020 could become the third extremely active season since 2005, and it will likely set a record of five consecutive above-normal seasons, surpassing the previous record of four set in 1998-2001 and 2016-2019.
The 2020 Atlantic hurricane season has already produced a May-July record of nine named storms, with seven tropical storms and two hurricanes. For the remainder of the season, we expect (with 70% probability for each range) an additional 10-16 named storms, with 5-9 becoming hurricanes and 3-6 of those becoming major hurricanes.
Extremely active seasons typically have more storms threatening the U.S. Gulf Coast and Atlantic Coast, and the entire region around the Caribbean Sea. Already this season, five named storms have made landfall in the continental U.S.; three as tropical storms (Bertha in South Carolina, Christobal in Louisiana, and Fay in New Jersey) and two as hurricanes (Hanna in Texas and Isaias in North Carolina). Mexico was also impacted by Christobal and Hanna.
Reasons why the likelihood of an above-normal season has increased
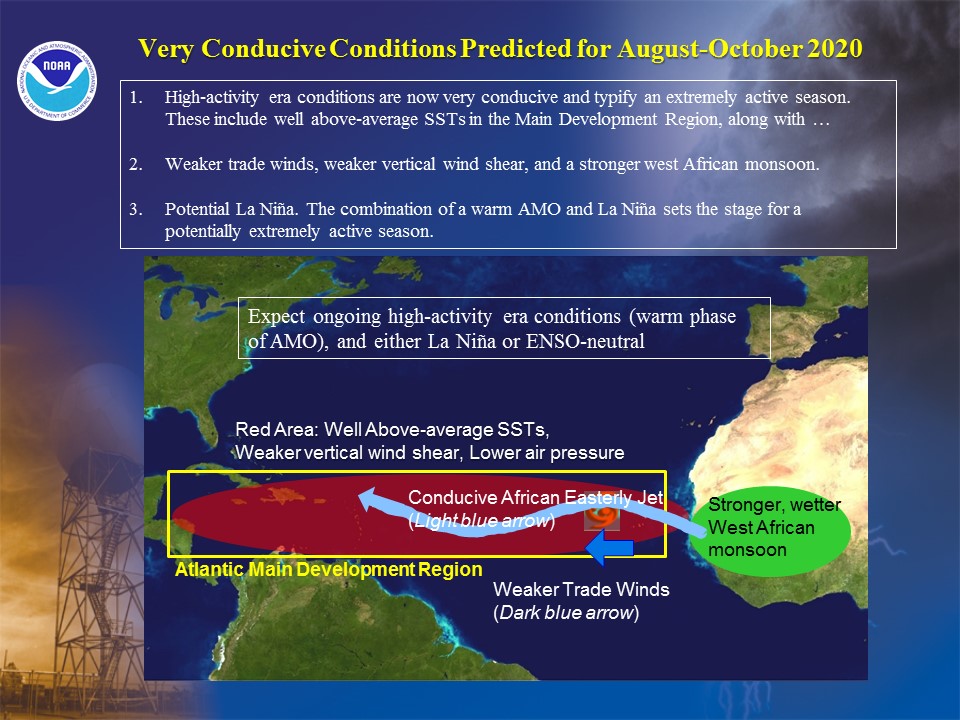
The increased likelihood of an above-normal, and possibly extremely active, season reflects three main factors:
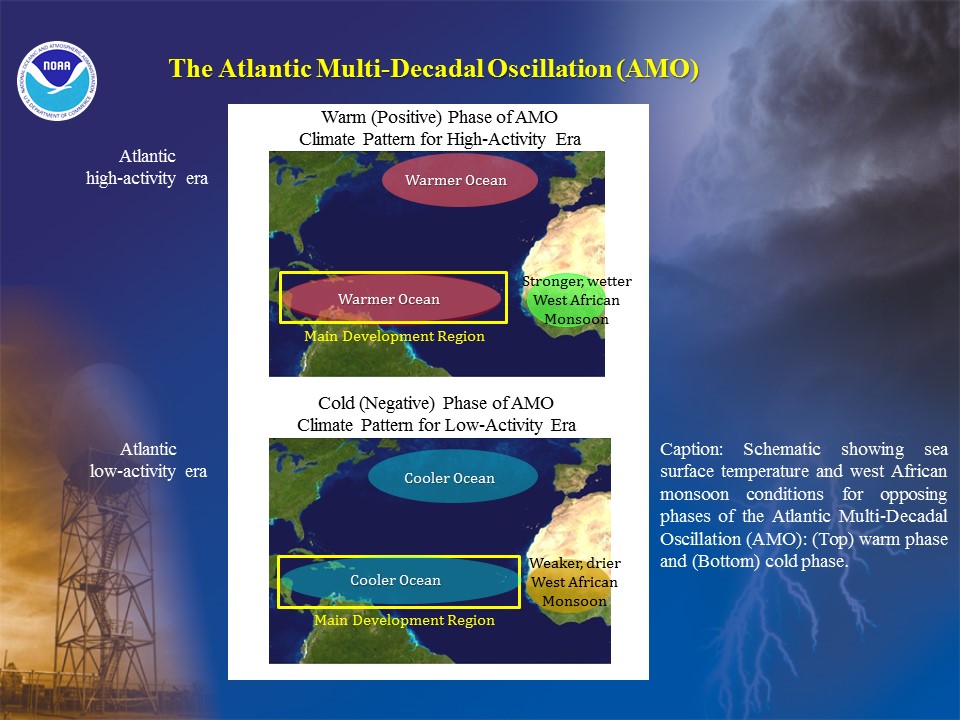
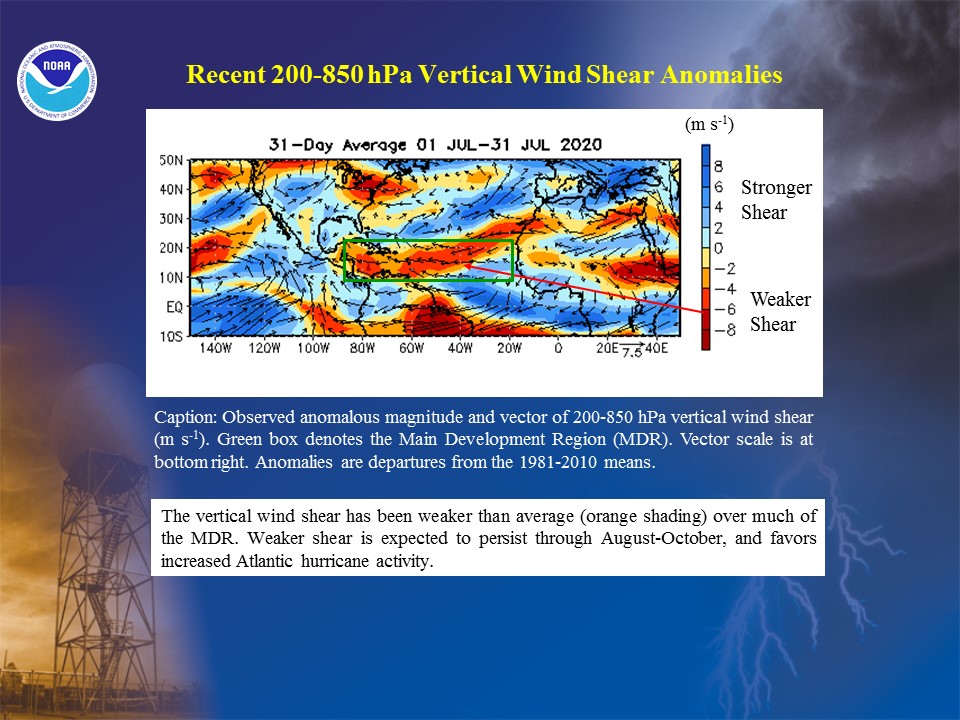
1. Atmospheric and oceanic conditions in the Atlantic hurricane Main Development Region (MDR) are even more conducive to hurricane formation than was predicted in May. The MDR spans the tropical Atlantic Ocean and Caribbean Sea (Goldenberg and Shapiro 1996). These conditions include exceptionally warm Atlantic sea surface temperatures, a stronger West African monsoon, weaker vertical wind shear, lower surface air pressure, weaker trade winds, and more conducive wind patterns coming off of Africa.
2. There is an increased likelihood of La Niña during August-October (50% or greater chance now compared to 40% chance in May), and some La Niña-like atmospheric conditions already appear to be in place. La Niña typically reduces the vertical wind shear over the Atlantic, thus also favoring a more active hurricane season. There is virtually no chance that El Niño will develop and suppress the hurricane season.
3. Models now predict an even more active season than they did in May, along with a higher potential for an extremely active season.
Preparedness for Tropical Storm and Hurricane Landfalls
It only takes one storm hitting an area to cause a disaster. Therefore, residents, businesses, and government agencies of coastal and near-coastal regions are urged to prepare every hurricane season regardless of the overall activity predicted by this, or any other, seasonal outlook.
DISCUSSION
1. Expected 2020 activity
NOAA's updated 2020 Atlantic Hurricane Season Outlook indicates that an above-normal hurricane season is very likely, and there is an increased possibility of the season being extremely active. The outlook indicates an 85% chance of an above-normal season, only a 10% chance of a near-normal season, and a nominal 5% chance of a below-normal season.See NOAA definitions of above-, near-, and below-normal seasons.
The total seasonal activity is measured by NOAA's Accumulated Cyclone Energy (ACE) index, which accounts for the combined intensity and duration of all named storms and hurricanes during the season. This outlook indicates a 70% chance that the 2020 seasonal ACE range will be 140%-230% of the median. This activity is higher than was predicted in May (110%-190% of the median ACE), and is entirely above NOAA's lower threshold (120% of median) for an above-normal season (Jon; Link here to the Background Information). Also, the updated ACE range is centered at 185% of median, which is above NOAA's lower threshold (165% of median) for an extremely active season. Therefore, 2020 could become the third extremely active season since 2005, and it could also set a record of five consecutive above-normal seasons.
The 2020 Atlantic hurricane season is now predicted to produce (with 70% probability for each range) 19-25 named storms (which includes the nine named storms to date), of which 7-11 are expected to become hurricanes, and 3-6 of those are expected to become major hurricanes. These ranges are centered well above the 1981-2010 averages of about 12 named storms, 6 hurricanes and 3 major hurricanes.
Predicting the location, number, timing, and strength of tropical storm and hurricane landfalls are ultimately related to the daily weather patterns, storm genesis locations, and steering patterns. These patterns are not predictable weeks or months in advance. As a result, it is not possible to reliably predict the number or intensity of landfalling storms in a seasonal outlook, or whether a given locality will be impacted by a hurricane this season. Therefore, residents, businesses, and government agencies of coastal and near-coastal regions are urged to prepare every hurricane season regardless of this, or any other, seasonal outlook.
2. Science behind the 2020 Outlook
NOAA's updated 2020 Atlantic hurricane season outlook reflects three main factors, all of which point to a very high likelihood of an above-normal season, and also to a potentially extremely active season.
Atmospheric and oceanic conditions now present within the MDR are exceptionally conducive for hurricane development, and are predicted to last through the peak months of the hurricane season (August-October). The underlying climate factor for these conditions is the ongoing Atlantic high-activity era, which began in 1995 in association with a transition to the warm phase of the AMO (Goldenberg et al. 2001, Bell and Chelliah 2006, Klotzbach and Gray 2008). There is about a 50% chance of La Niña during August-October, and virtually no chance that El Niño will develop and suppress the hurricane activity this season. The combination of La Niña and a warm phase of the AMO typically results in exceptionally weak vertical wind shear in the MDR, which favors activity near the upper ends of the predicted ranges. All models now predict the season to be even more active than they did in May, with most also predicting the possibility of an extremely active season.
These expectations are based on extensive monitoring, analysis, and research activities, a suite of statistical prediction tools, and dynamical model forecasts. The dynamical model predictions come from the NOAA Climate Forecast System (CFS), NOAA Geophysical Fluid Dynamics Lab (GFDL) FLOR-FA model, the United Kingdom Met Office (UKMET) GloSea5 model, and the European Centre for Medium Range Weather Forecasting (ECMWF) model. ENSO forecasts also use a combination of statistical and other dynamical models contained in the suite of Niño 3.4 SST forecasts, which is compiled by the IRI (International Research Institute for Climate and Society) and the NOAA Climate Prediction Center.
a. Predicted very conducive conditions in the MDR
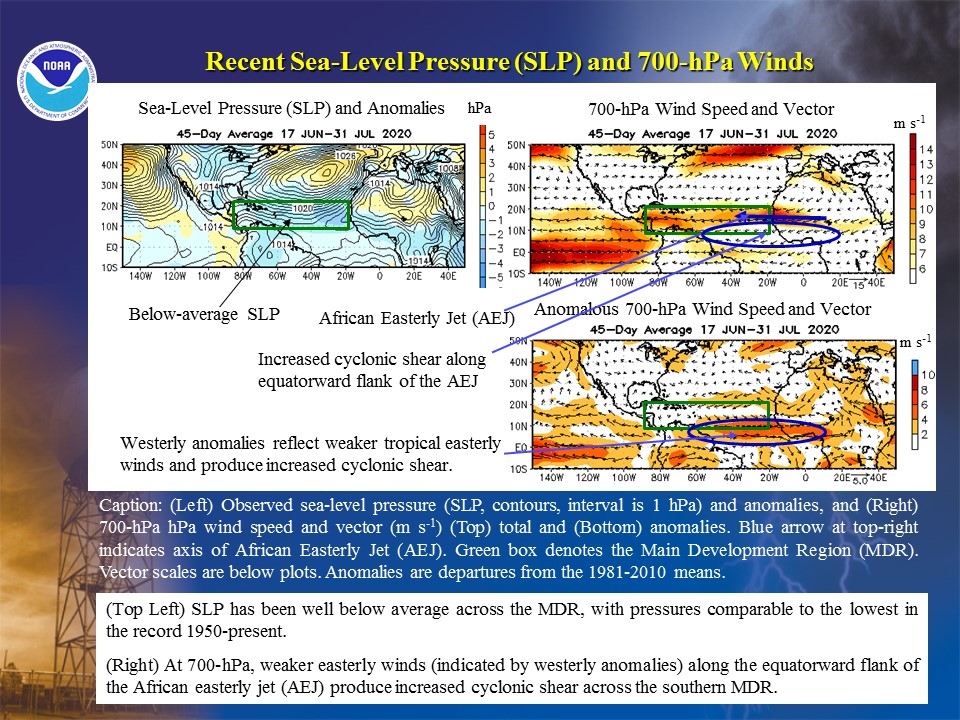
An inter-related set of atmospheric and oceanic conditions, which is very conducive for hurricane development, is now present in the MDR and is expected to continue through the hurricane season. These conditions are typical of other extremely active seasons in the historical record. They include above-average SSTs, weaker vertical wind shear, a stronger upper-level subtropical ridge, lower sea-level pressure (SLP), weaker tropical easterly trade winds, and a more conducive African Easterly Jet (AEJ), all in association with a stronger west African monsoon system. As we have often seen and discussed since 1995, this set of conditions allows for stronger African easterly waves, from which tropical storms and hurricanes can more easily develop (Bell and Chelliah, 2006). These storms then have an extended area in which to intensify as they propagate westward over progressively warmer waters, and within an environment of reduced vertical wind shear, increased tropical moisture, and decreased atmospheric stability. The result is more, stronger, and longer-lived storms.
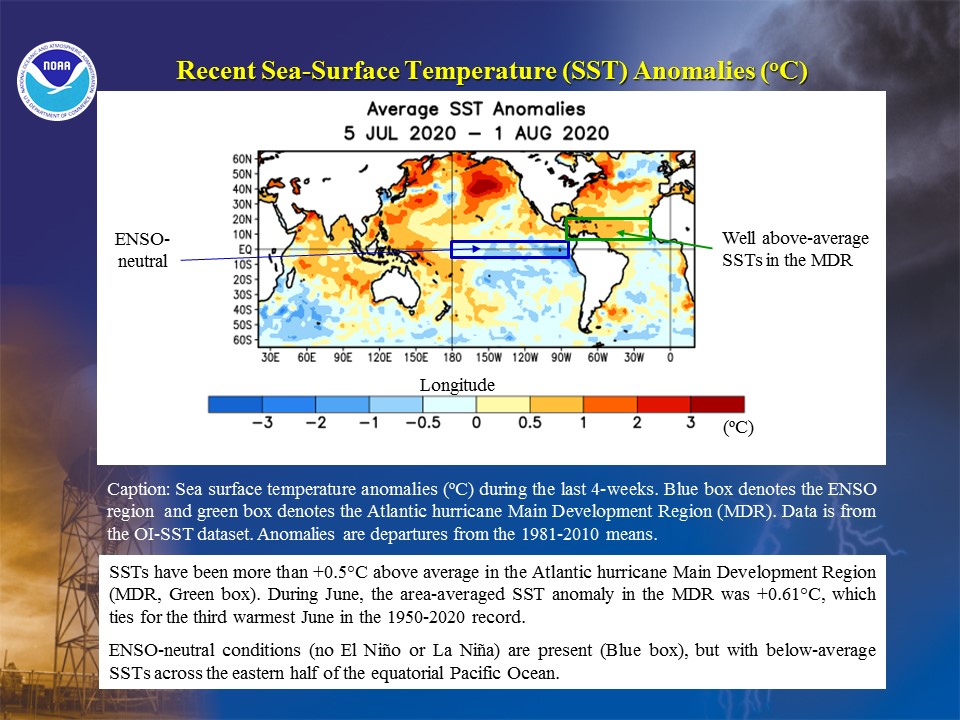
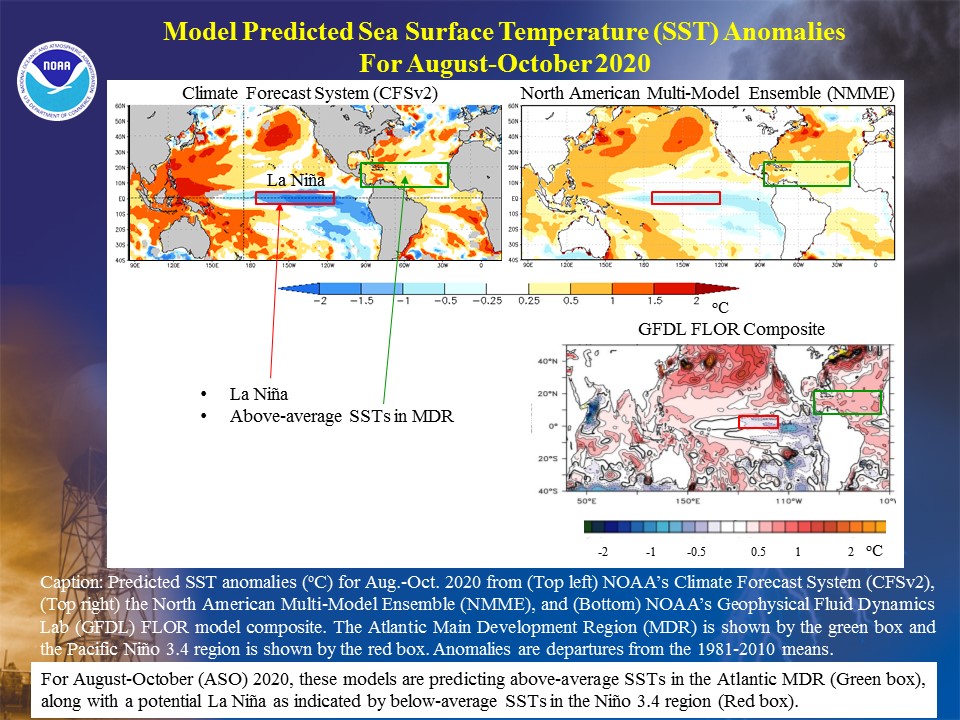
SSTs are currently well above average across the MDR, with most locations having departures of more than +0.5°C. Exceptional warmth has been present in the MDR throughout the summer, and the MDR area-averaged anomaly during June was +0.6°C. This value is the third largest for June in the record 1950-present. This warmth is related to a combination of weaker northeasterly low-level winds into the eastern MDR, and weaker low-level tropical easterly trade winds in the southern MDR, both of which reflect the lower SLP across the MDR. The CFS, NMME, and GFDL models all predict a continuation of above-average SSTs during ASO.
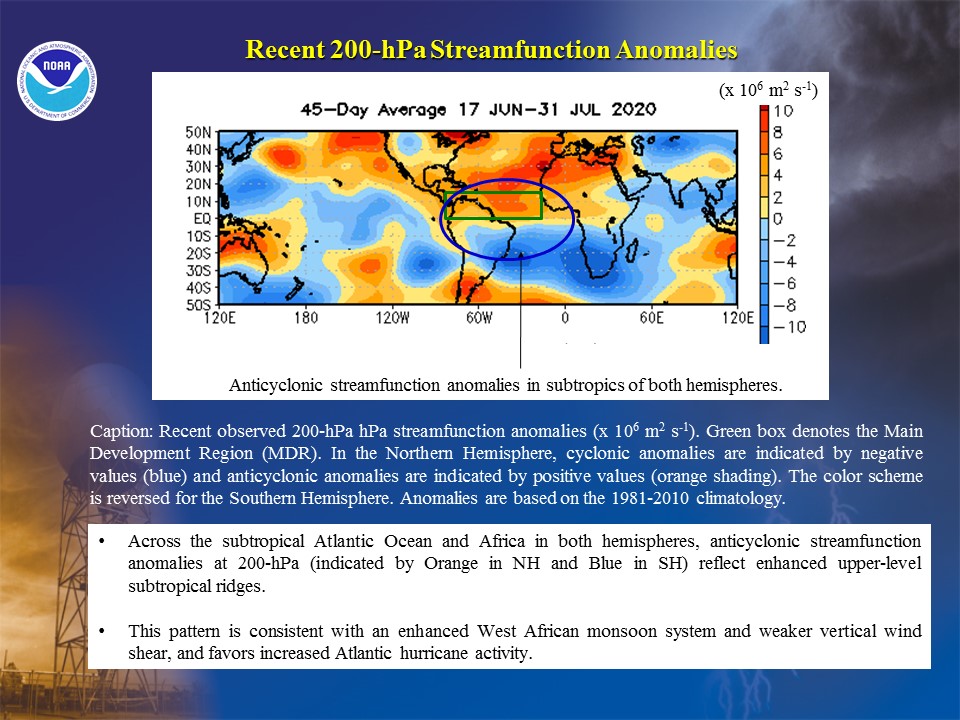
The vertical wind shear also remains weaker than average across most of the MDR, in response to a combination of weaker easterly trade winds and weaker upper-level westerly winds. These upper-level wind anomalies are situated along the southern flank of a persistent and amplified subtropical ridge at 200-hPa, as indicated by positive streamfunction anomalies extending from the Caribbean Sea across tropical northern Africa. Similarly, anticyclonic streamfunction anomalies in the Southern Hemisphere subtropics (shown by opposite shading from the Northern Hemisphere) extend from South America to central Africa. This overall streamfunction pattern is directly related to an enhanced West African monsoon system.
Also in place is a more conducive African easterly Jet. This wind pattern reflects weaker easterly winds (i.e., anomalous westerlies) along the equatorward flank of the AEJ axis. The resulting increase in cyclonic relative vorticity is more conducive to the intensification of African easterly waves, especially when that same environment features reduced vertical wind shear, increased moisture, and decreased atmospheric stability.
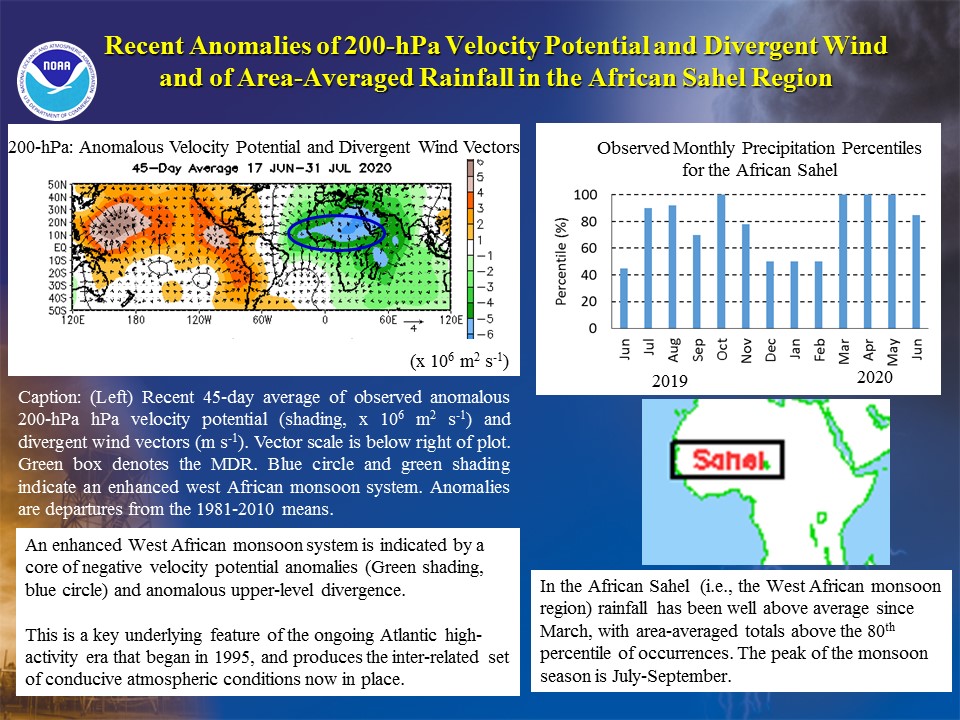
The above atmospheric conditions are all consistent with an enhanced West African monsoon system, which is an integral component of the warm AMO phase. The West African monsoon has been enhanced all summer, as indicated by negative velocity potential anomalies and enhanced upper-level divergence throughout the region. In fact, the monsoon rains have been well above average for several months, indicating an early start to the monsoon season as well.
b. La Niña or ENSO-neutral
Another climate pattern that can significantly impact Atlantic hurricane activity is the El Niño/ Southern Oscillation (or ENSO) (Gray 1984). ENSO is a coupled ocean-atmosphere phenomenon located over the central and eastern equatorial Pacific Ocean. ENSO has three phases: El Niño, Neutral and La Niña. El Niño, which refers to long periods (9-12 months) with above-average SSTs across the central and eastern equatorial Pacific, typically suppresses Atlantic hurricane activity. Conversely, La Niña, which refers to similar long periods with below average SSTs in the equatorial Pacific, typically enhances Atlantic hurricane activity. ENSO-neutral means no El Niño or La Niña.
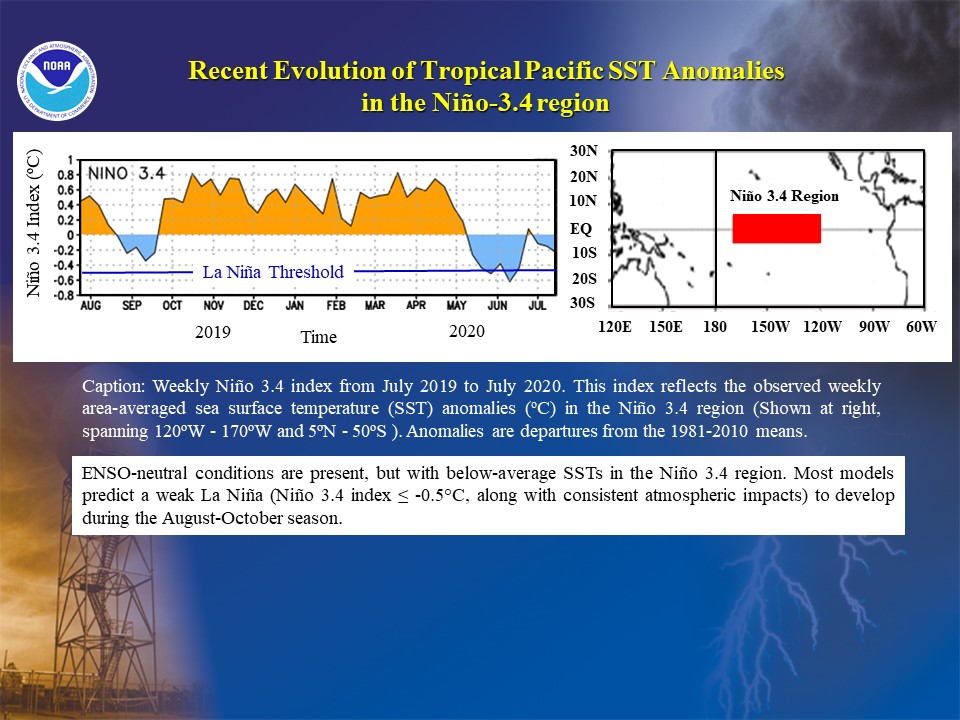
The CPC classifies ENSO events and their strength using the area-averaged SST anomaly in the Niño 3.4 region, an area of the east-central equatorial Pacific between 170°W- 120°W and 5°N-5°S. ENSO-neutral conditions are indicated by sustained Niño 3.4 region SST anomalies between -0.5°C and +0.5°C. ENSO-neutral conditions have been present this summer, but with generally below-average SSTs in the Niño 3.4 region.
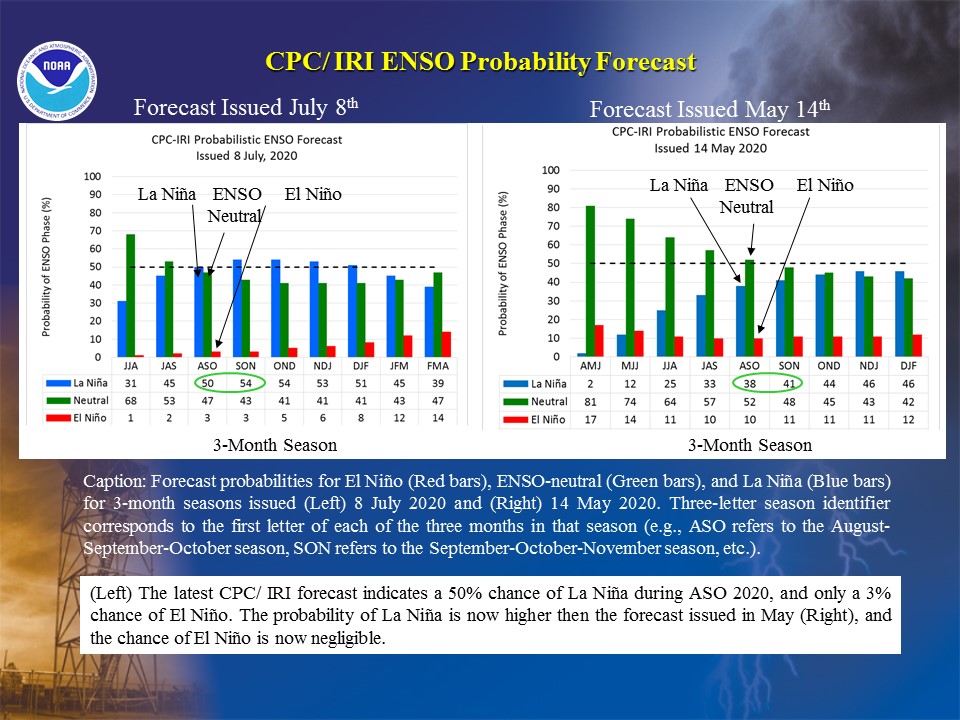
The CPC's latest ENSO probability forecast issued in July predicts a 50% chance of La Niña during ASO, and about a 55% chance later in the season. These numbers have increased from the forecast issued in May, which indicated about a 40% chance of La Niña during ASO 2020. The latest averages of the dynamical and statistical model predictions (thick orange and green lines, respectively) now predict La Niña to develop during ASO or Sep.-Nov. (SON). La Niña is classified by Niño 3.4 index of -0.5°C or cooler, along with consistent atmospheric impacts.
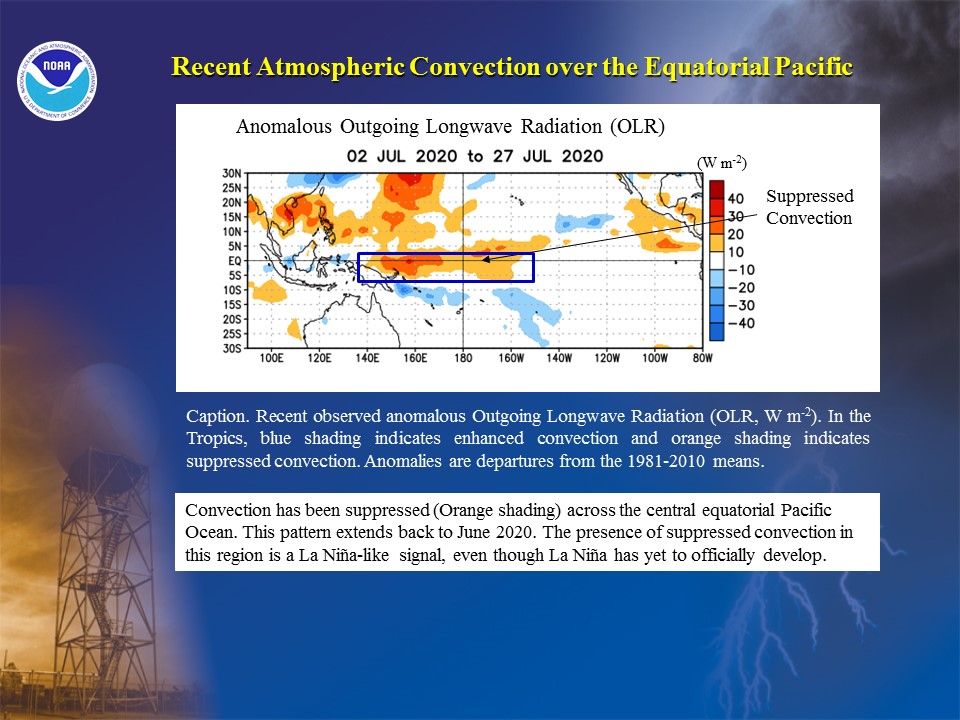
Recent observations suggest that atmospheric and oceanic conditions continue to evolve toward La Niña. The latest weekly Niño 3.4 index value was -0.8 °C, which exceeds CPCs lower threshold for La Niña. These cooler SSTs have been associated with suppressed atmospheric convection across the central and east-central equatorial Pacific Ocean which, in turn favors enhanced easterly trade winds in that region leading to additional oceanic cooling.
The pattern of anomalous convection now in place acts to weaken the downstream upper-level westerly winds over the Caribbean Sea, thus reducing the vertical wind shear and favoring increased Atlantic hurricane activity. The combination of La Niña and the warm AMO sets the stage for a potentially extremely active season.
NOAA FORECASTERS
Climate Prediction Center
- Dr. Gerry Bell, Lead Forecaster, Meteorologist; Gerry.Bell@noaa.gov
- Matt Rosencrans, Meteorologist; Matthew.Rosencrans@noaa.gov
- Dr. Hui Wang, Physical Scientist; Hui.Wang@noaa.gov
National Hurricane Center
- Eric Blake, Hurricane Specialist; Eric.S.Blake@noaa.gov
- Dr. Chris Landsea, Meteorologist; Chris.Landsea@noaa.gov
- Dr. Richard Pasch, Hurricane Specialist; Richard.J.Pasch@noaa.gov
Atlantic Oceanographic and Meteorological Laboratory Hurricane Research Division
- Stanley Goldenberg, Meteorologist; Stanley.Goldenberg@noaa.gov
REFERENCES
Bell, G. D., and M. Chelliah, 2006: Leading tropical modes associated with interannual and multi-decadal fluctuations in North Atlantic hurricane activity. J. Climate, 19, 590-612. Blake, E. S., P. Klotzbach, and G. D. Bell, 2018: Climate factors causing the extremely active 2017 Atlantic hurricane season. Presented at AMS 33rd Conference on Hurricanes and Tropical Meteorology, April 2018. Goldenberg, S. B. and L. J. Shapiro, 1996: Physical mechanisms for the association of El Niño and West African rainfall with Atlantic major hurricane activity. J. Climate, 9, 1169-1187. Goldenberg, S. B., C. W. Landsea, A. M. Mestas-Nuñez, and W. M. Gray, 2001: The recent increase in Atlantic hurricane activity: Causes and implications. Science, 293, 474-479. Gray, W. M., 1984: Atlantic seasonal hurricane frequency: Part I: El Niño and 30-mb quasi-bienniel oscillation influences. Mon. Wea. Rev., 112, 1649-1668. Klotzbach, P.J., and W. M. Gray, 2008: Multi-decadal Variability in North Atlantic Tropical Cyclone Activity. J. Climate, 21, 3929 - 3935.
|


