[Next Article] -
[Previous Article]
Forecasts of Equatorial Pacific SST Anomalies Based
on Singular Spectrum Analysis Combined with the Maximum Entropy
Method
Ning Jiang, Michael Ghil and David Neelin
Department of Atmospheric Sciences and Institute of Geophysics and Planetary Physics
University of California, Los Angeles, California
Singular spectrum analysis (SSA: Vautard and
Ghil 1989; Ghil and Vautard 1991; Plaut et al. 1995)
and the maximum entropy method (MEM: Burg 1968;
Penland et al. 1991) are used here for long-lead
forecasts of the sea-surface temperature (SST)
anomalies averaged over the Niño 3 area and the
Southern Oscillation Index (SOI). The forecast is for
up to one year ahead, based on the last 45 years of
observed data. More detailed information on the
forecast method based on single-channel SSA combined
with MEM is given by Keppenne and Ghil (1992),
while multi-channel SSA (M-SSA: Kimoto et al. 1991;
Keppenne and Ghil 1993; Plaut and Vautard 1994)
combined with MEM is documented in the March 1995
issue of this Bulletin (Jiang et al. 1995). Briefly, the
time series is filtered first by SSA (if univariate) or
M-SSA (if multivariate), so that the statistically
significant components are retained, specifically the
quasi- quadrennial (QQ) and the quasi-biennial (QB)
components of ENSO variability (Rasmusson et al.
1990; Keppenne and Ghil 1992; Jiang et al. 1995).
Then MEM is applied to advance these components in
time.
Figure 1 shows area-averaged Niño 3 SSTAs,
forecast and observed, since 1990, using the SSA and
MSSA-MEM schemes for a 3-, 6-, 9- and 12-month
lead. The last forecast, for the next 1-4 seasons, using
data through January 1996, is shown in Fig. 2. The
vertical bars are one standard deviation in length, based
on forecast verification over the 1984-93 time span.
The forecasts indicate that the presently slightly cooler
than normal or near-normal conditions in Niño 3 may
continue through 1996. Figure 3 shows the SSA-MEM
forecast for the SOI from February 1996 through
January 1997. The SOI is expected to remain close to
its mean over this year. The present SOI forecast agrees
with the Niño 3 SSTA forecast, although the
anomalously weak (anti)correlation between these two
ENSO signals, which we pointed out in the September
1995 issue of this Bulletin, continues.
References
Burg, J.P., 1968: Maximum entropy spectral
analysis. Modern Spectrum Analysis, 34-48. IEEE
Press.
Ghil, M. and R. Vautard, 1991: Interdecadal
oscillations and the warming trend in global
temperature time series. Nature, 350, 324-327.
Jiang, N., D. Neelin and M. Ghil, 1995:
Quasi-quadrennial and quasi-biennial variability in the
equatorial Pacific. Clim. Dyn., 12, 101-112.
Jianag, N., M. Ghil and D. Neelin, 1995:
Forecasts of Equatorial Pacific SST anomalies using an
autoregressive process using singular spectrum analysis.
Experimental Long-Lead Forecast Bulletin, 4, 1, 24-27.
Keppenne, C.L. and M. Ghil, 1992: Adaptive
filtering and prediction of the Southern Oscillation
Index. J. Geophys. Res., 97: 20449-20454.
Keppenne, C.L. and M. Ghil, 1993: Adaptive
filtering and prediction of noisy multivariate signals
Adaptive filtering and prediction of noisy multivariate
signals: An application to subannual variability in
atmospheric angular momentum. Intl. J. Bif. & Chaos,
3, 625-634.
Kimoto, M., M. Ghil and K.C. Mo, 1991: Spatial
structure of the 40-day oscillation in the Northern
Hemisphere extratropics. Proc. 8th Conf. Atmos. &
Oceanic Waves & Stability. Amer. Met. Soc., Boston,
115-116.
Penland, C., M. Ghil and K.M. Weickmann, 1991:
Adaptive filtering and maximum entropy spectra, with
application to changes in atmospheric angular
momentum. J. Geophys. Res., 96, 22,659-22,671.
Plaut, G.R., M. Ghil and R. Vautard, 1995:
Interannual and interdecadal variability in 335 years of
central England temperature. Science, 268, 710-713.
Rasmusson E.M., X. Wang and C. F. Ropelewski,
1990: The biennial component of ENSO variability. J.
Mar. Sys., 1, 71-96.
Vautard R., and M. Ghil, 1989: Singular spectrum
analysis in nonlinear dynamics with applications to
paleoclimatic time series. Physica D, 35, 395-424.
Figures
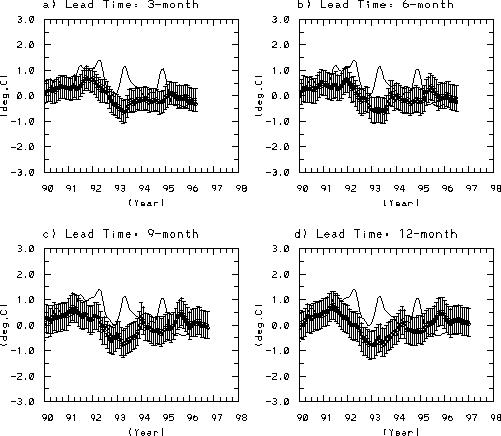
Figure 1. Forecasts of the
area-averaged NiÊo 3 SST anomalies (SSTAs) by the SSA-MEM (star) and
MSSA-MEM (circle) schemes. The solid line indicates the observed NiÊo
3 SSTAs. The latest forecast starts from January 1996, shown for lead
times of (a) 3 months, (b) 6 months, (c) 9 months and (d) 12 months.
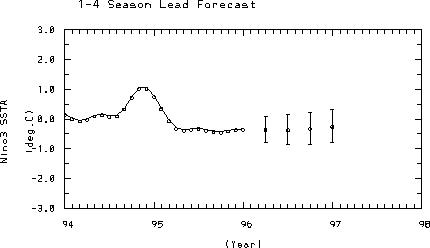
Figure 2. SSA-MEM forecasts
of Nino-3 SSTAs for the upcoming 4 seasons, with a January 1996 start
time. The solid line indicates the observed Nino-3 SSTAs.
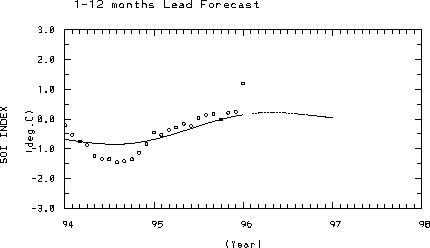
Figure 3. SSA-MEM forecast for
the SOI for February 1996 through January 1997. The circles represent
the raw monthly SOI values without the seasonal cycle, and the solid
line the SSA-filtered SOI. The dashed line indicates the forecast
for the coming 12 months.
[Purpose] -
[Contents] -
[Editorial Policy] -
[Next Article] -
[Previous Article]