|
NCEP Coupled Model Forecasts of Eq. Pac. SST and Anomalies
MARCH 2018
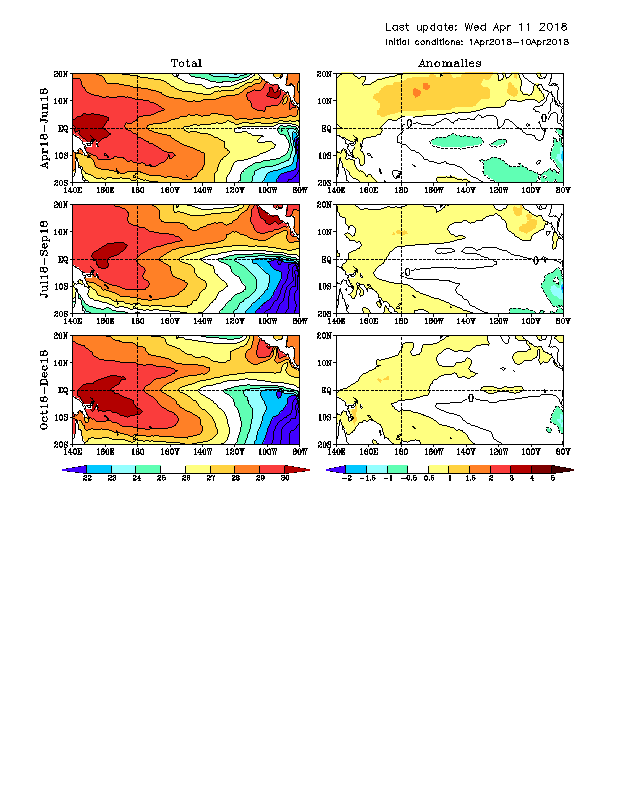
FIGURE F3.
Predicted 3-month average sea surface
temperature (left) and anomalies (right) from the NCEP Coupled
Forecast System Model (CFSv2). The forecasts consist of 40 forecast
members. Contour interval is 1C, with additional contours for
0.5C and -0.5C. Negative anomalies are indicated by dashed
contours.
|