|
APRIL 2012
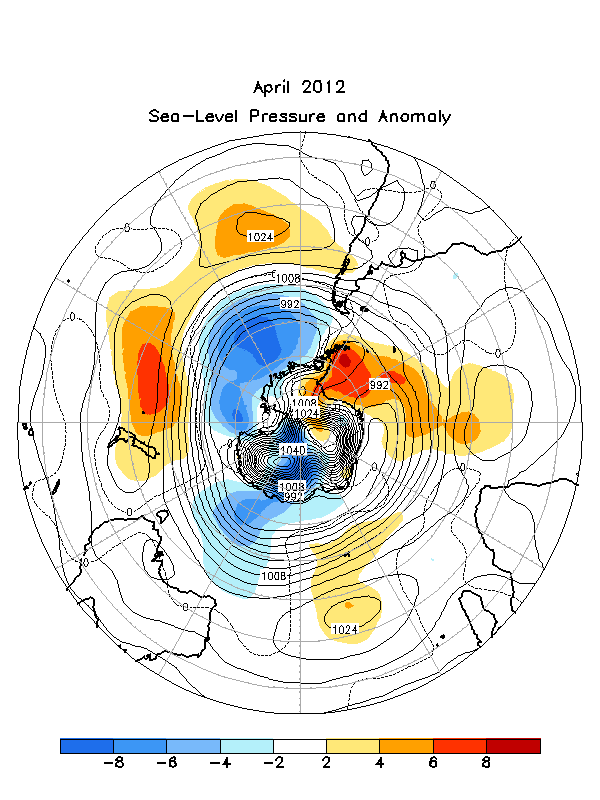
FIGURE E14.
Southern Hemisphere mean
and anomalous sea level pressure (CDAS/Reanalysis). Mean values are
denoted by solid contours drawn at an interval of 4 hPa. Anomaly
contour interval is indicated by shading. Anomalies are calculated as
departures from the 1981-2010 base period monthly means.
|