 |
MAY 2014
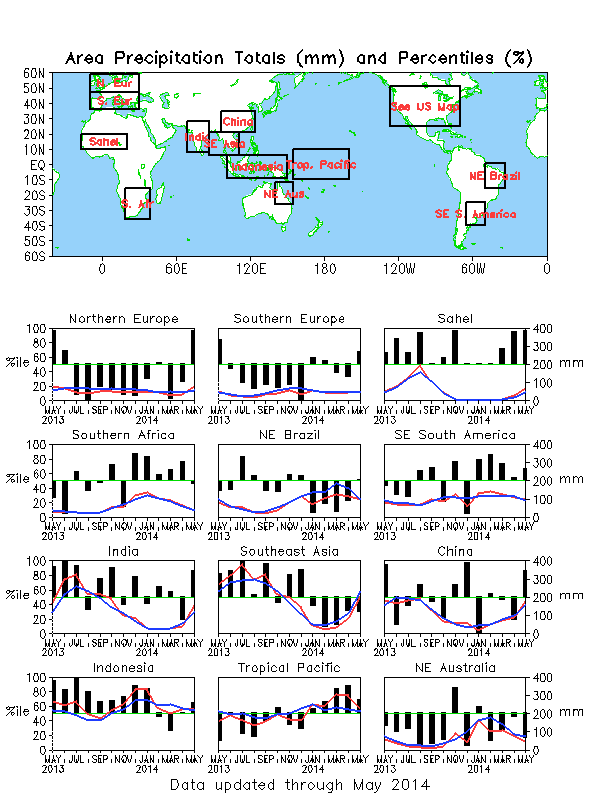
FIGURE E4.
Areal estimates of monthly mean
precipitation amounts (mm, red lines) and precipitation percentiles
(%, bars) for the most recent 13 months obtained from a merge of
raingauge observations and satellite-derived precipitation estimates (Janowiak
and Xie 1999, J. Climate, 12, 3335-3342). The monthly
precipitation climatology (mm, blue lines) is from the 1981-2010
base period monthly means. Monthly percentiles are not shown if the
monthly mean is less than 5 mm.
|
 |


