|
Tropical Pacific Drifting Buoys
Rick Lumpkin / Mayra Pazos, AOML, Miami
OCTOBER 2022
During October 2022, 207 satellite-tracked surface drifting buoys were
reporting from the tropical Pacific. Westward anomalies of ~1 m/s were measured
by three near-equatorial drifters at 160-170W, possibly associated with a
mesoscale feature. rather than a broader-scale anomaly. Several drifters at
10-20S, 120-140W exhibited westward anomalies, but this pattern was not seen by
drifters further west in this latitude band. Elsewhere, currents were close to
their climatological October values.
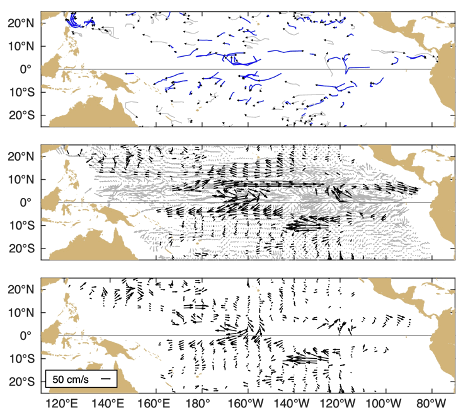
FIGURE A1.1
a) Top: Movements of drifting buoys in the tropical Pacific Ocean.
The linear segments of each trajectory represent a one week displacement.
Trajectories of buoys which have lost their subsurface drogues are gray; those with
drogues are blue.
b) Middle: Monthly mean currents calculated from all buoys 1993-2010 (gray),
and currents measured by the drogued buoys this month (black) smoothed by an
optimal filter.
c) Bottom: Anomalies from the climatological monthly mean currents for this month.
|