|
TAO/TRITON Array Time-Longitude Section
Chung-Chu Teng/Richard L. Crout
NOAA/NWS/NDBC
DECEMBER 2008
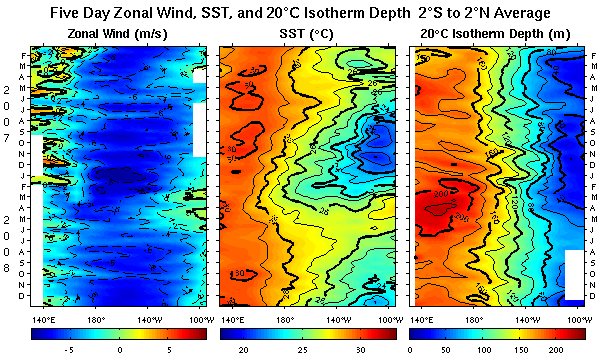
FIGURE A1.3
Time-longitude sections of surface zonal winds (m s-1), sea surface
temperature (C) and 20C isotherm depth (m) for the past 24 months. Analysis is based
on 5-day averages of moored time series data from the TAO/TRITON array. Positive winds are westerly.
Squares on the abscissas indicate longitude where data were available at the start of the
time series (top) and end of the time series (bottom). The TAO/TRITON array is presently supported
by the United States (NOAA), Japan (STA), and France (IRD).
Further information is available from Richard L. Crout (NOAA/NDBC).
|