|
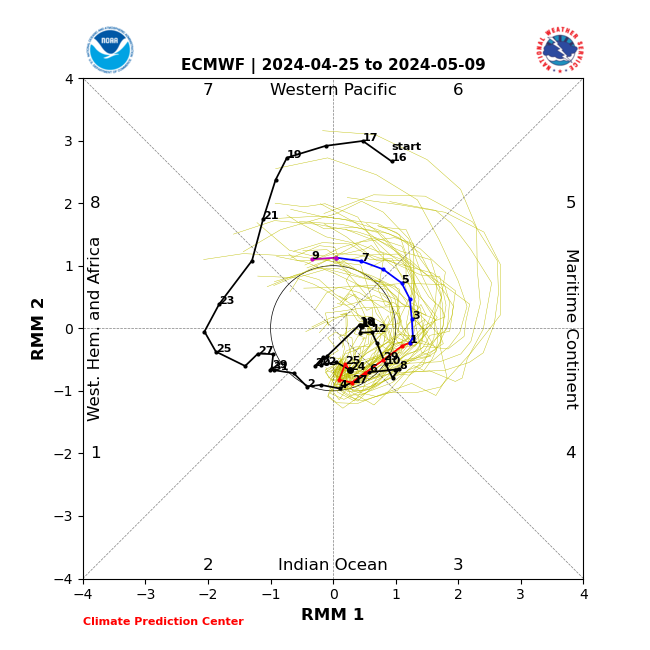
Phase diagram showing the evolution of the last 40 days of observations (black) along with the ensemble forecast.
The yellow lines are the ensemble members and the red, blue, and purple lines are the ensemble mean denoting various time ranges of the forecast
(red: days 1-7, blue: days 8-14, purple: >=day15).
|