|
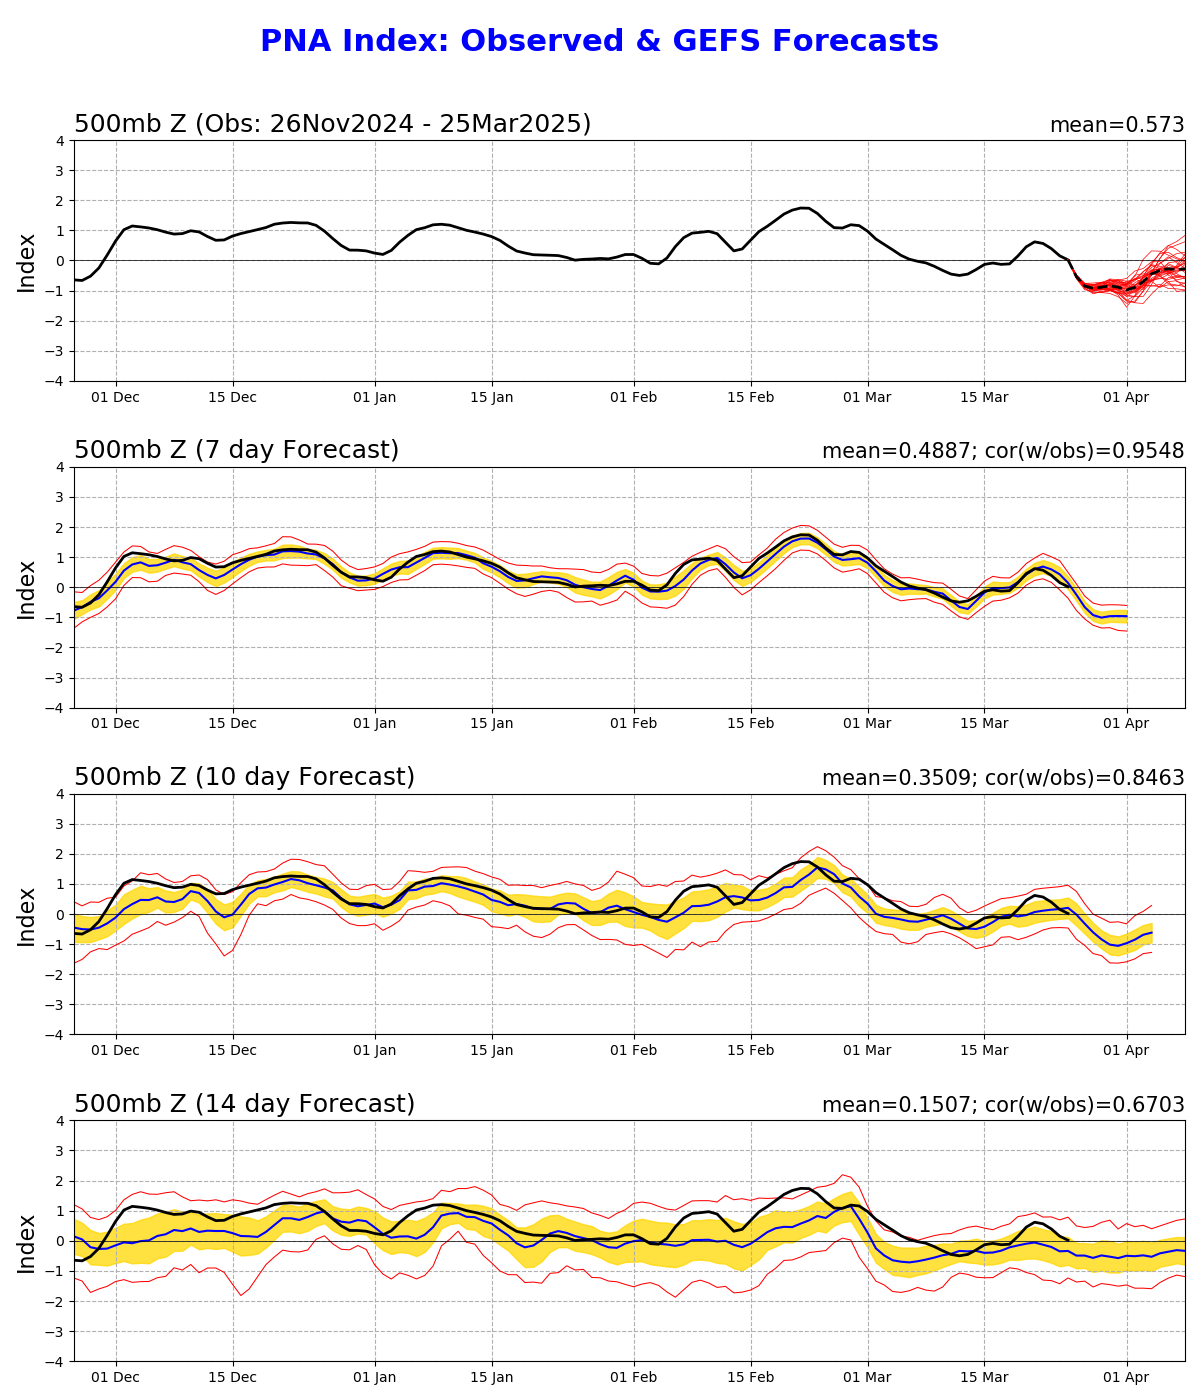
The daily PNA indices are shown for the previous 120 days, and the ensemble forecasts of the daily PNA index at selected lead times are appended onto the time series. The indices are standardized by standard deviation of the observed monthly PNA index from 1950-2000 interpolated to the day in question. A 3-day running mean is applied to the forecast time series.
The values at the upper left and right corners of each figure indicate the mean value of the PNA index and the correlation coefficients between the observations and the forecasts, respectively.
The first panel shows the observed PNA index (black line) plus forecasted PNA indices from each of the 11 MRF ensemble members starting from the last day of the observations (red lines).
The ensemble mean forecasts of the PNA index are obtained by averaging the 11 MRF ensemble members (blue lines), and the observed PNA index (black line) is superimposed on each panel for comparison. For the forecasted indices (lower 3 panels), the yellow shading shows the ensemble mean plus and minus one standard deviation among the ensemble members, while the upper and lower red lines show the range of the forecasted indices, respectively.
|