 |
Satelite-Derived Surface Currents
Kathleen Dohan, Earth & Space Research
JUNE 2016
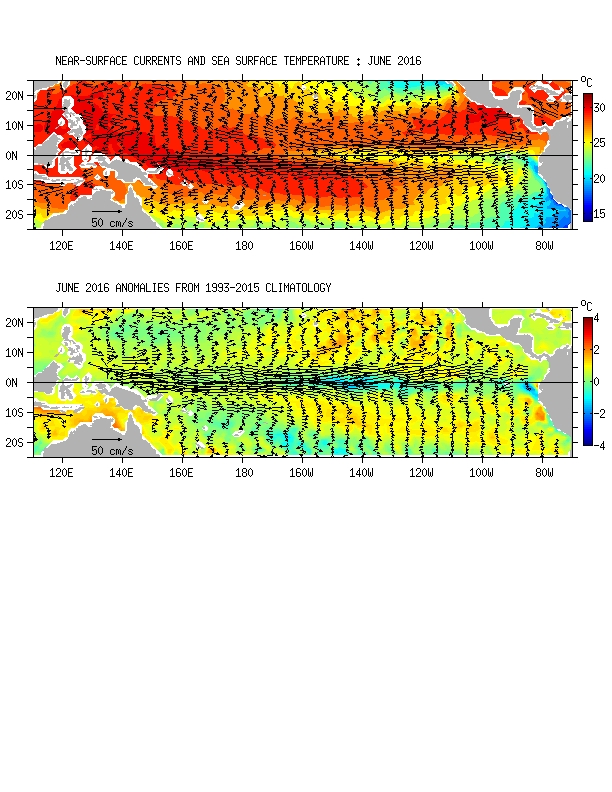
FIGURE A1.3
Ocean Surface Current Analysis-Real-time (OSCAR)
(Bonjean and Lagerloef 2002, J. Phys. Oceanogr., Vol. 32, No. 10, 2938-2954;
Lagerloef et al. 1999, JGR-Oceans, 104, 23313-23326). (top) Total velocity. Satellite
data included Jason sea level anomalies and QuickScat winds. Data were smoothed
with optimal filter (Lx~10°, Ly~2). (bottom) Velocity anomalies. The subtracted climatology
was based on SSM/I and QuickScat winds and Topex/Poseidon and Jason from 1993-2010.
See also http://www.oscar.noaa.gov.
|
 |


