|
ATTENTION:
The Climate Prediction Center is soliciting
comments from August 1, 2023 through December 31, 2024 on the implementation
of the Week 2
and experimental Week 3 Global Tropics Hazards Outlook.
Here is the Survey.
|
GTH Outlook Map and Data
|
Last Updated -
04/23/24
|

|
|
|
|
|
GTH Outlook Discussion
|
Last Updated -
04/23/24
|
Valid -
05/01/24 - 05/14/24
|
Following a robust Madden-Julian Oscillation (MJO) during March, it weakened during early to mid-April according to the RMM-based MJO index. However, the observed 200-hPa velocity potential anomaly field depicts a continued MJO signal with its enhanced phase rapidly shifting eastward over the Western Hemisphere during the past two weeks. As this remnant MJO constructively interferes with a low-frequency signal over eastern Africa and the western Indian Ocean, the GEFS and ECMWF ensemble mean feature an increase in anomalous upper-level divergence for these areas during late April. This is expected to result in a stronger and more coherent MJO heading into May. Although there is large model spread on the strength of the MJO during the outlook period (May 1-14), the MJO is expected to influence global tropical rainfall. MJO precipitation composites for phases 5, 6, and 7 were considered in the outlook.
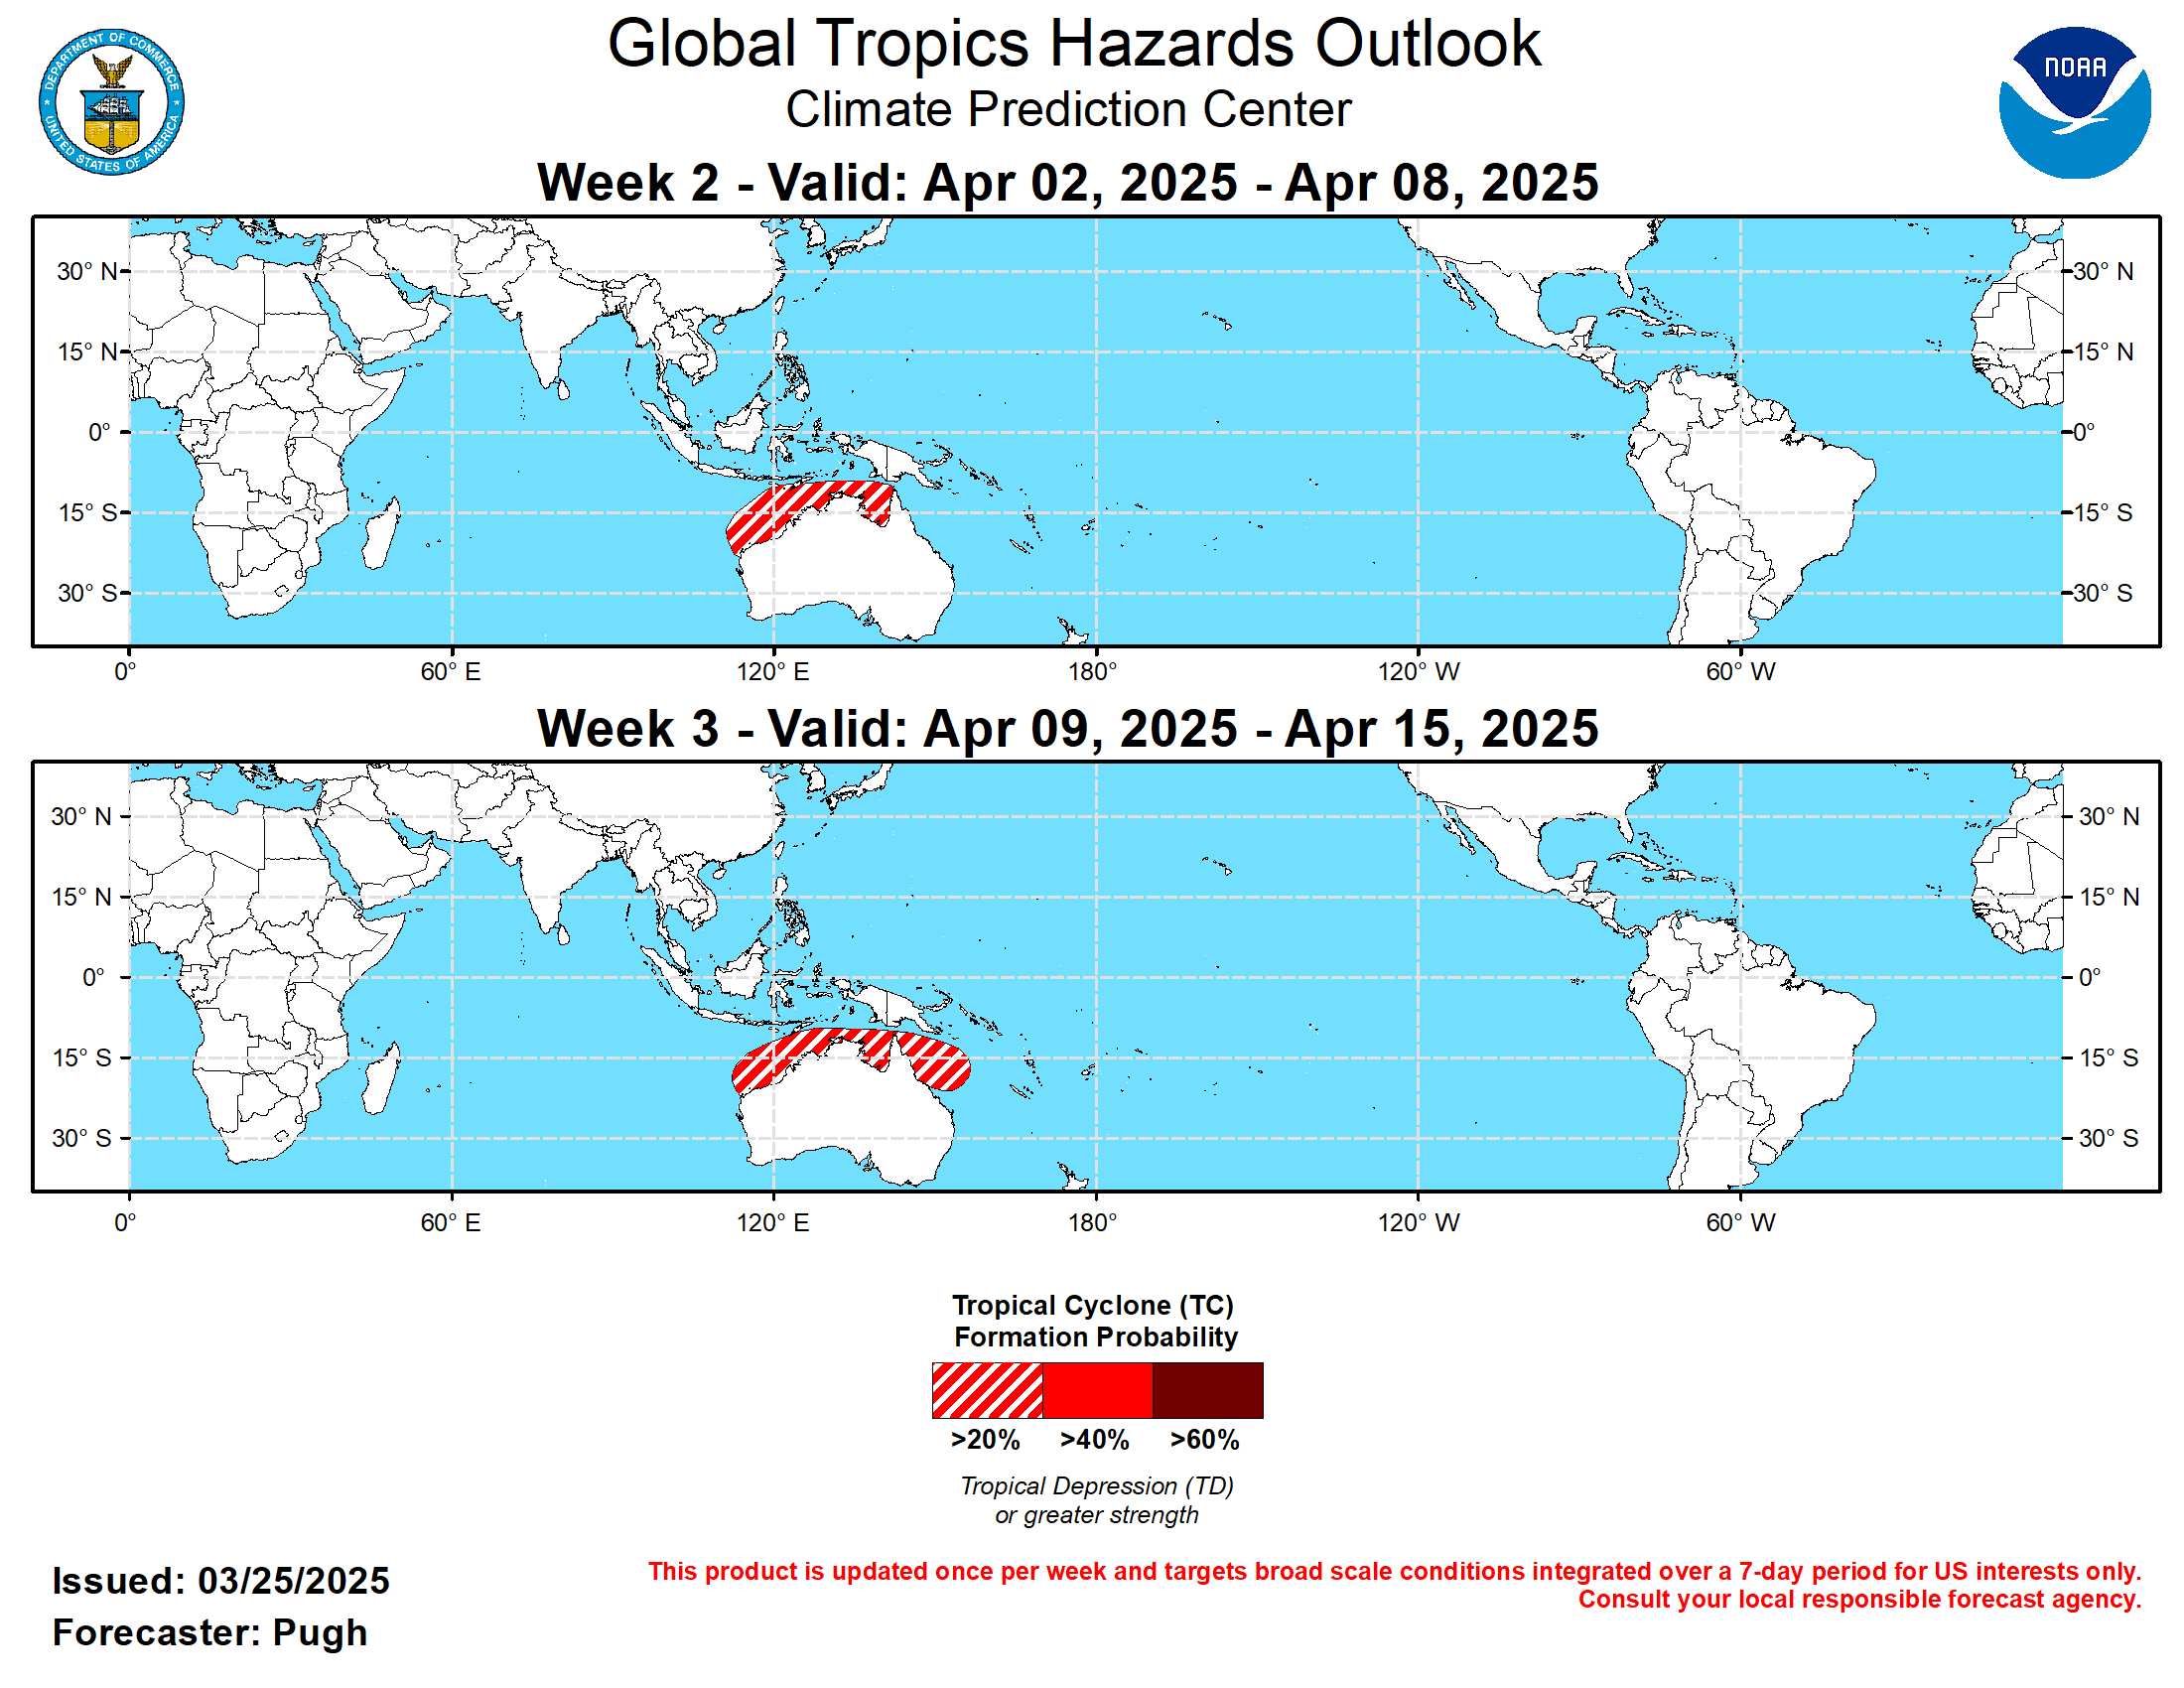
No tropical cyclones (TCs) formed during mid-April and this is typically a quiet time of year. Although recent deterministic GFS and ECMWF model runs have depicted TC genesis over the southern Indian Ocean near the beginning of May, low forecast confidence on a specific location and climatology preclude the designation of a 20 to 40 percent chance formation area. By week-3 (May 8-14), the large-scale environment is expected to become more favorable for TC development across the West Pacific. MJO composites and at least a weak model signal supports a 20 to 40 percent chance to the east of the Philippines. Beyond the outlook period and later in May, the MJO could favor an early season TC in the East Pacific. This will be closely monitored in subsequent outlooks.
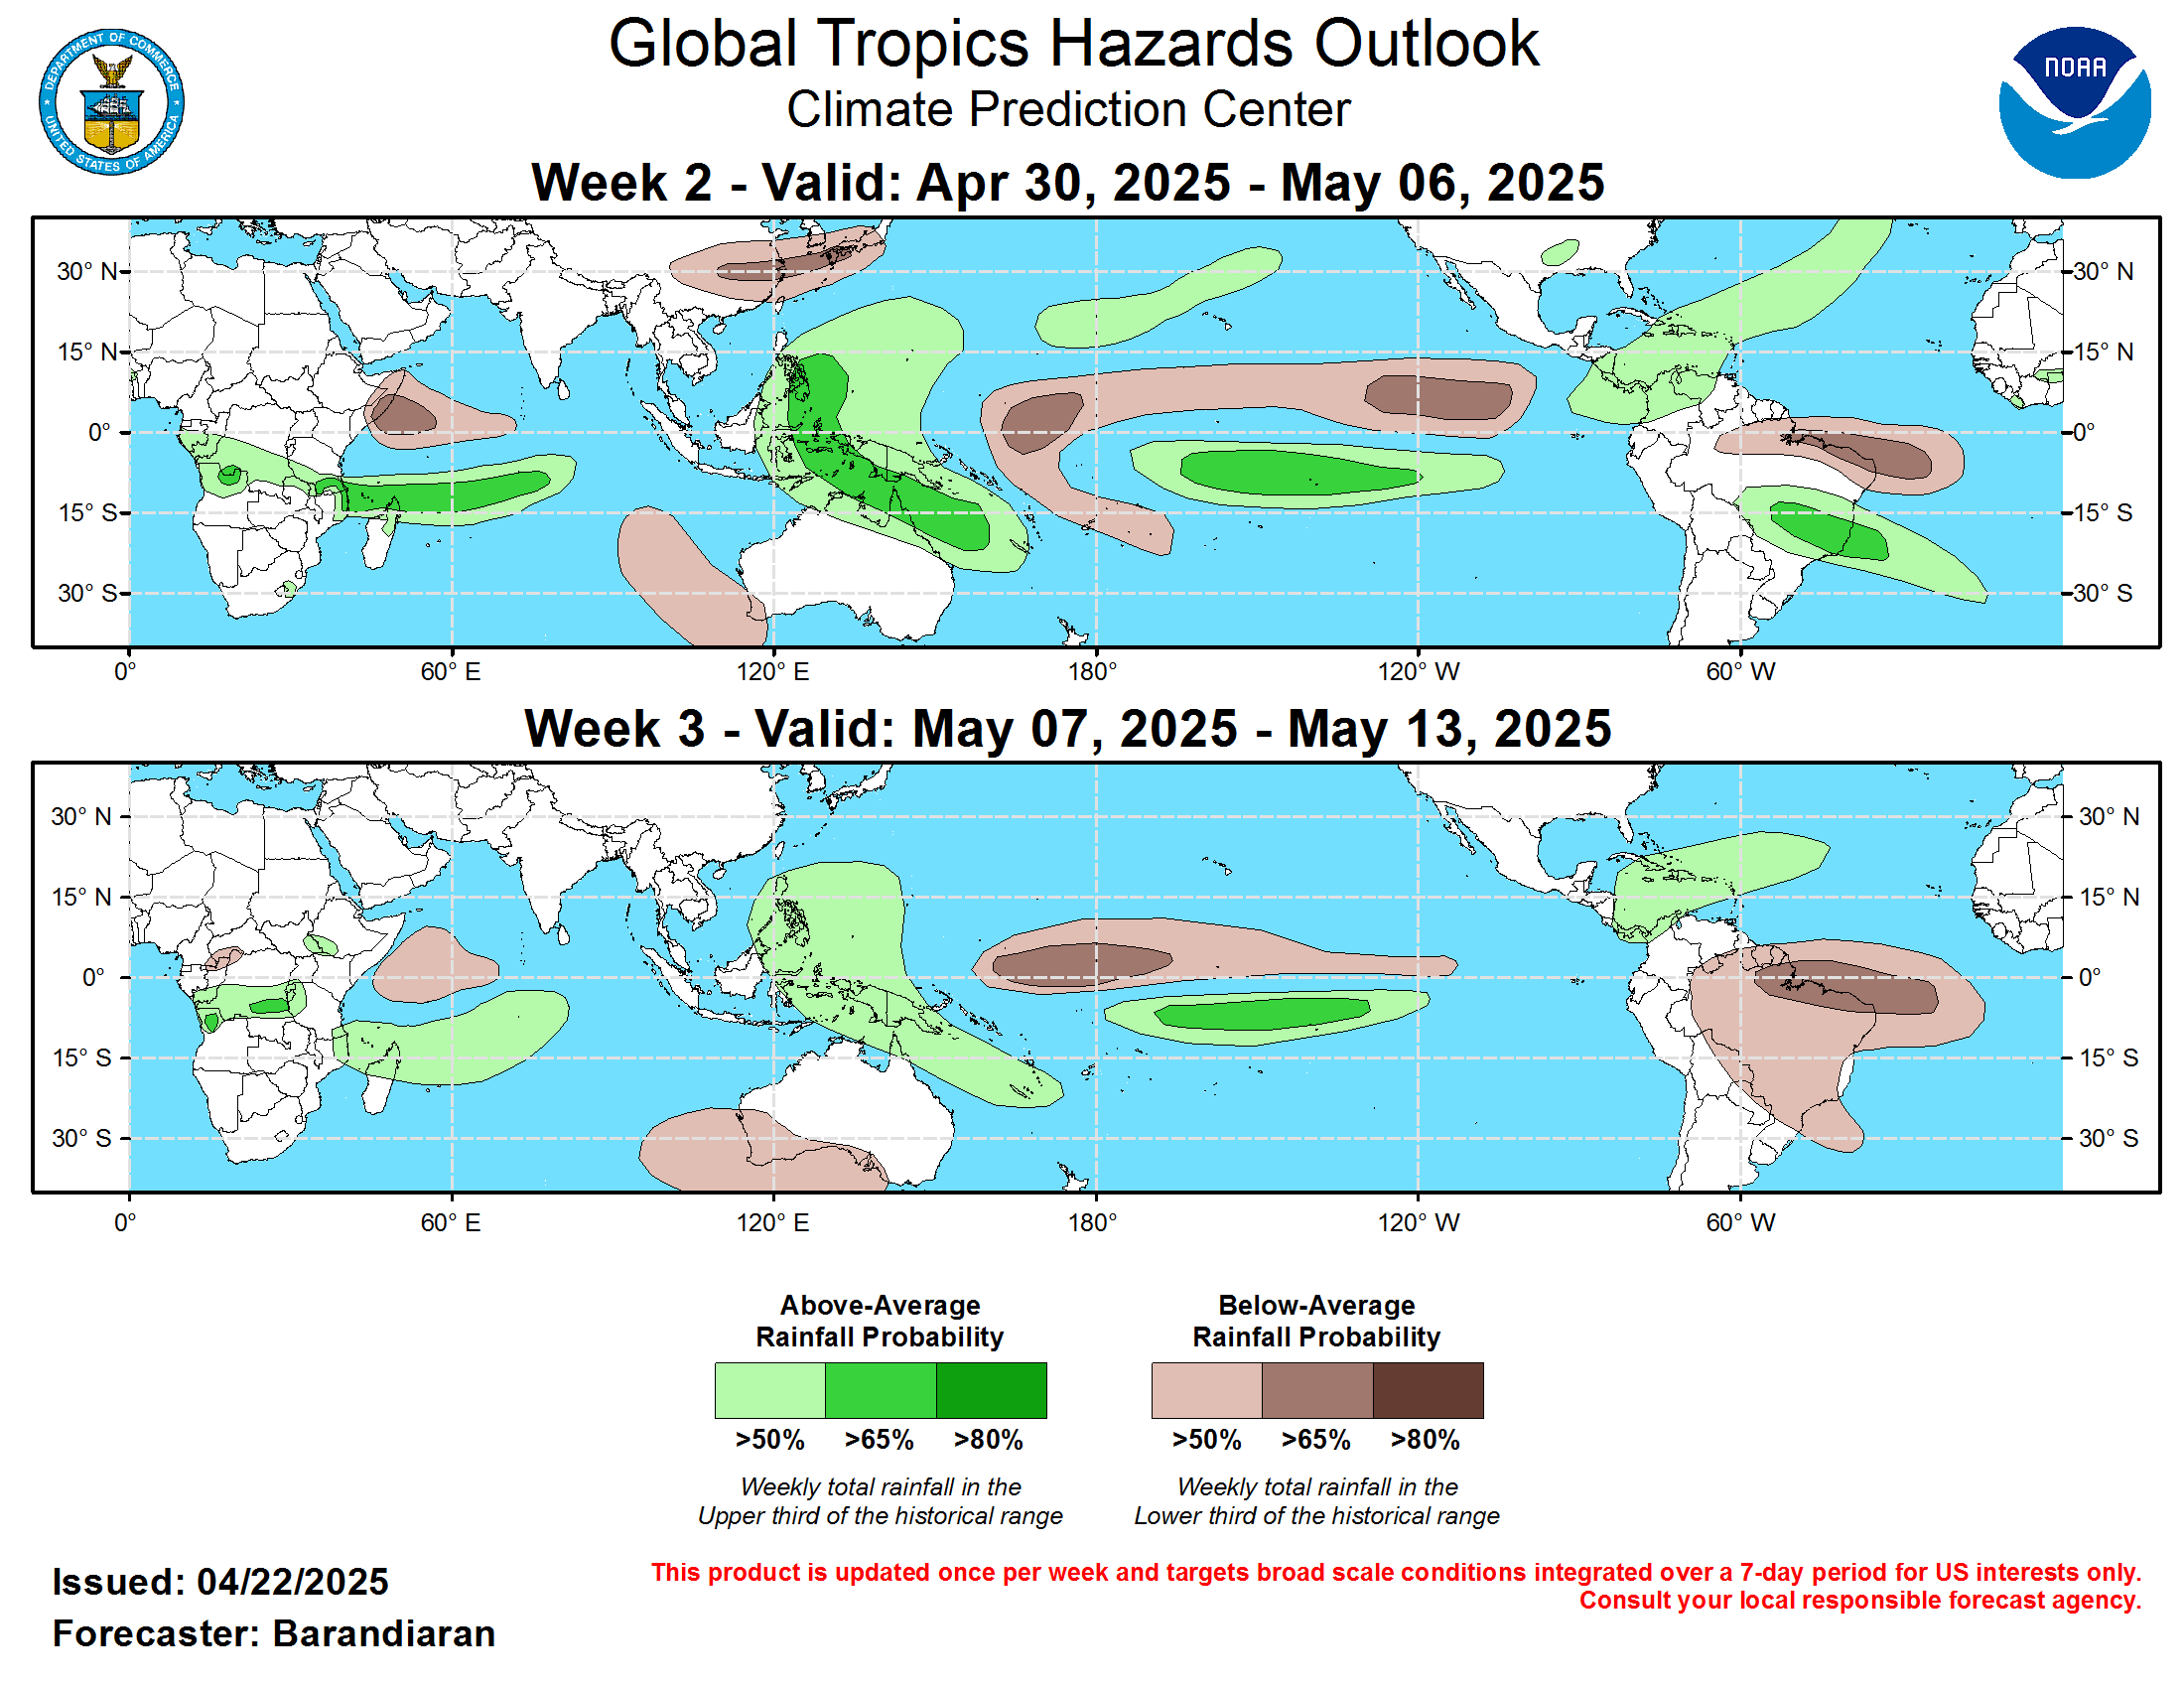
The precipitation outlook for weeks 2 and 3 are based on a historical skill weighted blend of the GEFS, CFS, ECCC, and ECMWF models and MJO precipitation composites (phases 5, 6, and 7). Puerto Rico and the U.S. Virgin Islands have been quite wet so far during April and this wet pattern is expected to persist into early May. Above-average rainfall is also favored for parts of eastern Africa, western Indian Ocean, and Maritime Continent (along the equator) during the first two weeks of May.
For hazardous weather conditions in your area during the coming two-week period, please refer to your local NWS office, the Medium Range Hazards Forecast produced by the Weather Prediction Center, and the CPC Week-2 Hazards Outlook. Forecasts made over Africa are made in coordination with the International Desk at CPC.
|
Product Release Information
The Global Tropics Hazards Outlook (GTH) is released once per week every Tuesday at 1730 UTC (1830 UTC when on standard time) including U.S. federal holidays.
At the time of product release, there is a live briefing (available via Google Meet) open to all stakeholders where the latest conditions and the newly
released outlook are shared with the opportunity to ask questions. Folks that are interested in learning more or attending these briefings should contact
Jon.Gottschalck@noaa.gov, Scott.Handel@noaa.gov, Adam.Allgood@noaa.gov and Nicholas.Novella@noaa.gov for the required information. Each weekly outlook and GTH release briefing is
Archived and available on the website.
|
Product Description
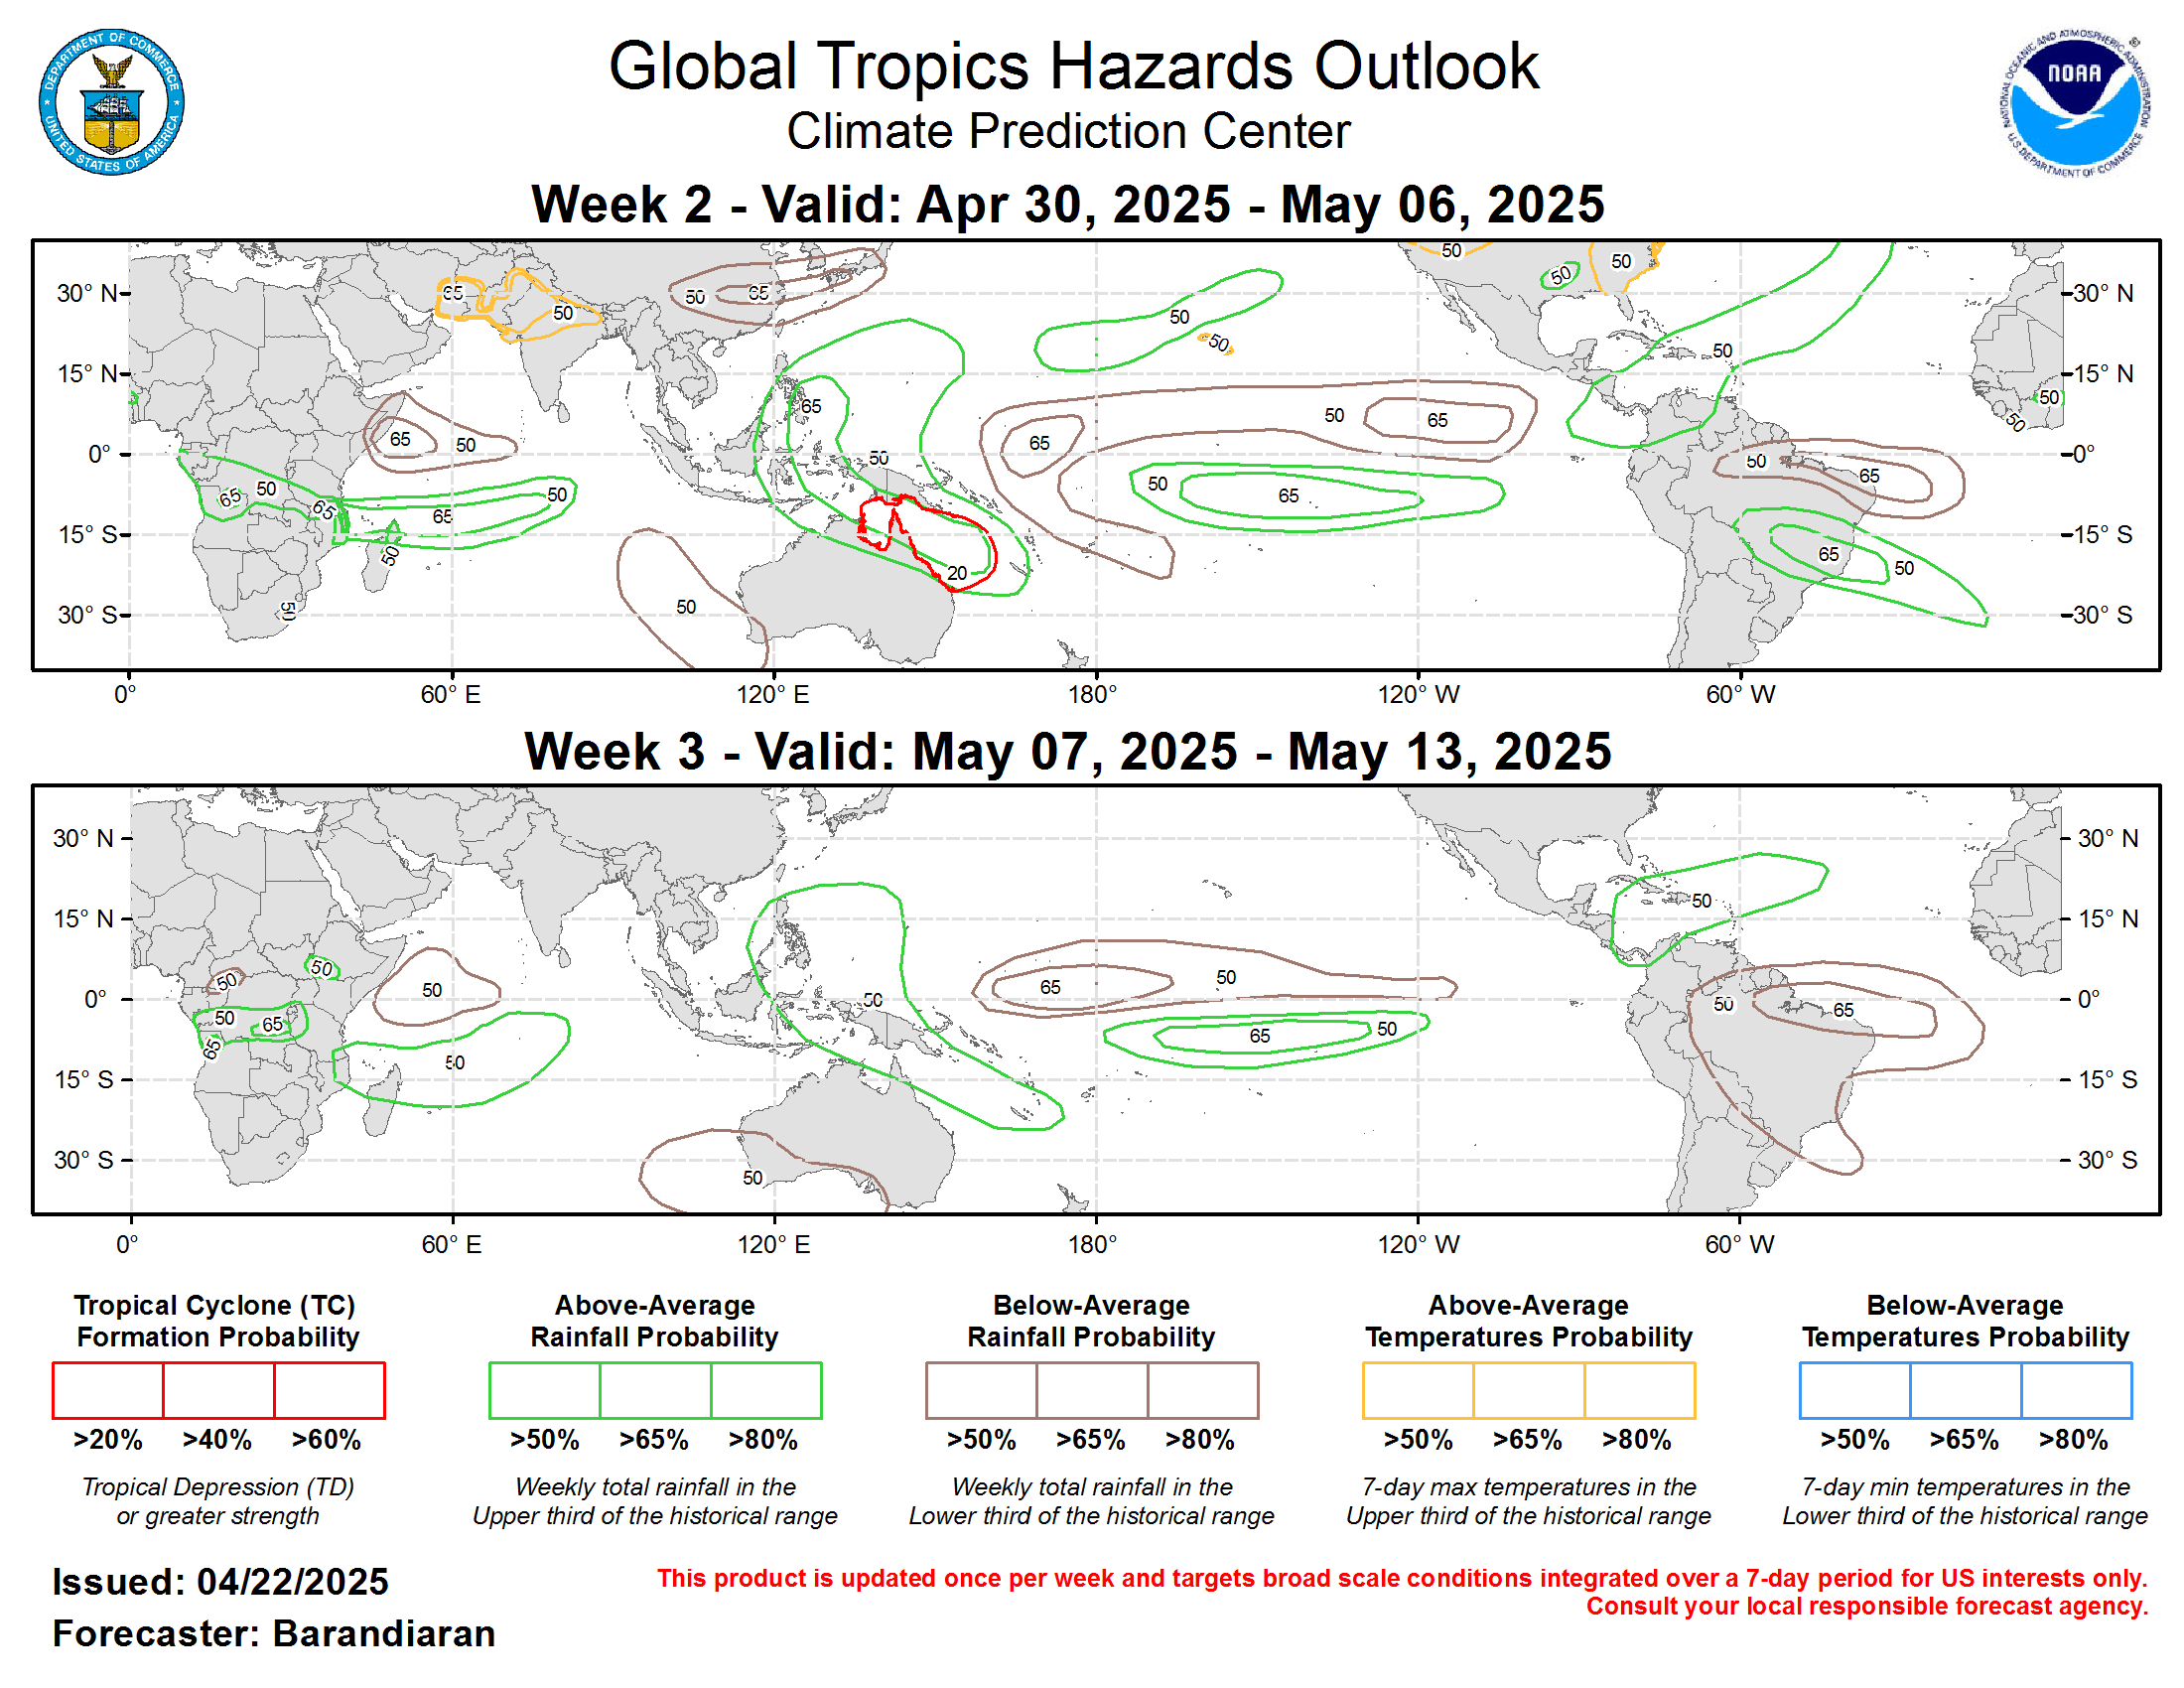
The Global Tropics Hazards Outlook is a probabilistic forecast for areas with elevated probabilities for above- or below-median rainfall, above- or below-normal
temperatures and regions where tropical cyclogenesis is favored for the upcoming Week-2 and Week-3 time periods. The rainfall outlook is for precipitation
integrated over a week and targets broad-scale patterns, not local conditions as they will be highly variable. Above (below) median rainfall forecast areas are
depicted in green and brown respectively. Above (below) normal temperature forecast areas are depicted in orange and blue respectively. Favored areas for tropical
development are shown in red. Three probability intervals are indicated for precipitation and temperature which are set at 50, 65, and 80%, while the probability
intervals for tropical cyclone development are set at 20, 40, and 60%. The weekly verification period ranges from 00 UTC Wednesday to 00 UTC the following
Wednesday.
Along with the product graphic, a written text outlook discussion is also included at release time. The narrative provides a review of the past week across
the global Tropics, a description of the current climate-weather situation, the factors and reasoning behind the depicted outlook and notes on any other
issues the user should be aware of. The discussion discusses the impacts in the Tropics as well as potential impacts in the Extratropics when relevant.
|
Product Physical Basis
The product synthesizes information and expert analysis related to climate variability across multiple time scales and from various sources, including operational
climate monitoring products. The physical basis for the outlooks include
El Nino-Southern Oscillation (ENSO) , the Madden-Julian Oscillation (MJO),
strength and variations of the monsoon systems, other coherent subseasonal tropical variability such as atmospheric Kelvin waves (KW), Equatorial Rossby waves
(ERW), African easterly waves, as well as interactions with the extratropical circulation (i.e. high latitude blocking, low-latitude frontal activity, etc.).
|
Product Forecast Tools
The outlook maps are currently based on a number of forecast tools, many of which are objective and serve as an objective first guess. The final depiction is an
assessment of these objective forecast tools augmented by the forecaster when based on additional forecast information when appropriate to create the final product.
Forecast tools include MJO composites, empirical and dynamical based MJO, ERW and KW forecasts, and bias-corrected dynamical model guidance from a number of modeling systems.
Tropical cyclone areas are based on MJO composites and statistical and dynamical tropical cyclone forecast guidance products as well as raw model forecast guidance.
|
Product Purpose
The product supports the NOAA mission in three primary ways:
- Assess and forecast important changes in the distribution of tropical convection (i.e., potential circulation changes across the Pacific and North America sectors) and communicate this information to NWS forecasters
- Provide advance notice of potential hazards related to climate, weather and hydrological events across the global tropics (including tropical cyclone risks for several NWS regions)
- Support various sectors of the U.S. economy (finance, energy, agriculture, water resource management) that have foreign interests.
|
Product Partners
The product is created through collaboration with other NOAA centers, [the National Hurricane Center (NHC) and the Central Pacific Hurricane
Center (CPHC)], the Department of Defense [The Joint Typhoon Warning Center (JTWC) and the Naval Postgraduate School (NPS)],
the Australian Bureau of Meteorology, Taiwan Central Weather Bureau, the State University of New York at Albany (SUNY) and the Center
for Climate and Satellites (CICS), among other collaborators.
|
Product Users and Applications
Known users include U.S. government agencies such as NOAA [National Weather Service (NWS), River Forecast Centers (RFCs), the National
Marine Fisheries Service (NMFS), the Department of the Interior (U.S. Forest Service), aid organizations (U.S. and international Red Cross,
USAID), domestic and global private sector interests (financial, energy, water resource management and agricultural sectors),
international weather services and various media meteorologists.
Some special applications of the product in the past include extended range predictions to support Haiti earthquake and Deepwater
Horizon oil spill relief efforts as well as support for the Dynamics of the MJO (DYNAMO) scientific field campaign held from
October 2011 through March 2012.
|
Product Resources
|
|
Feedback and Questions
|
|


