|
|
GTH Outlook Map and Data
|
Last Updated -
10/14/25
|

|
|
|
|
|
GTH Outlook Discussion
|
Last Updated -
10/14/25
|
Valid -
10/22/25 - 11/04/25
|
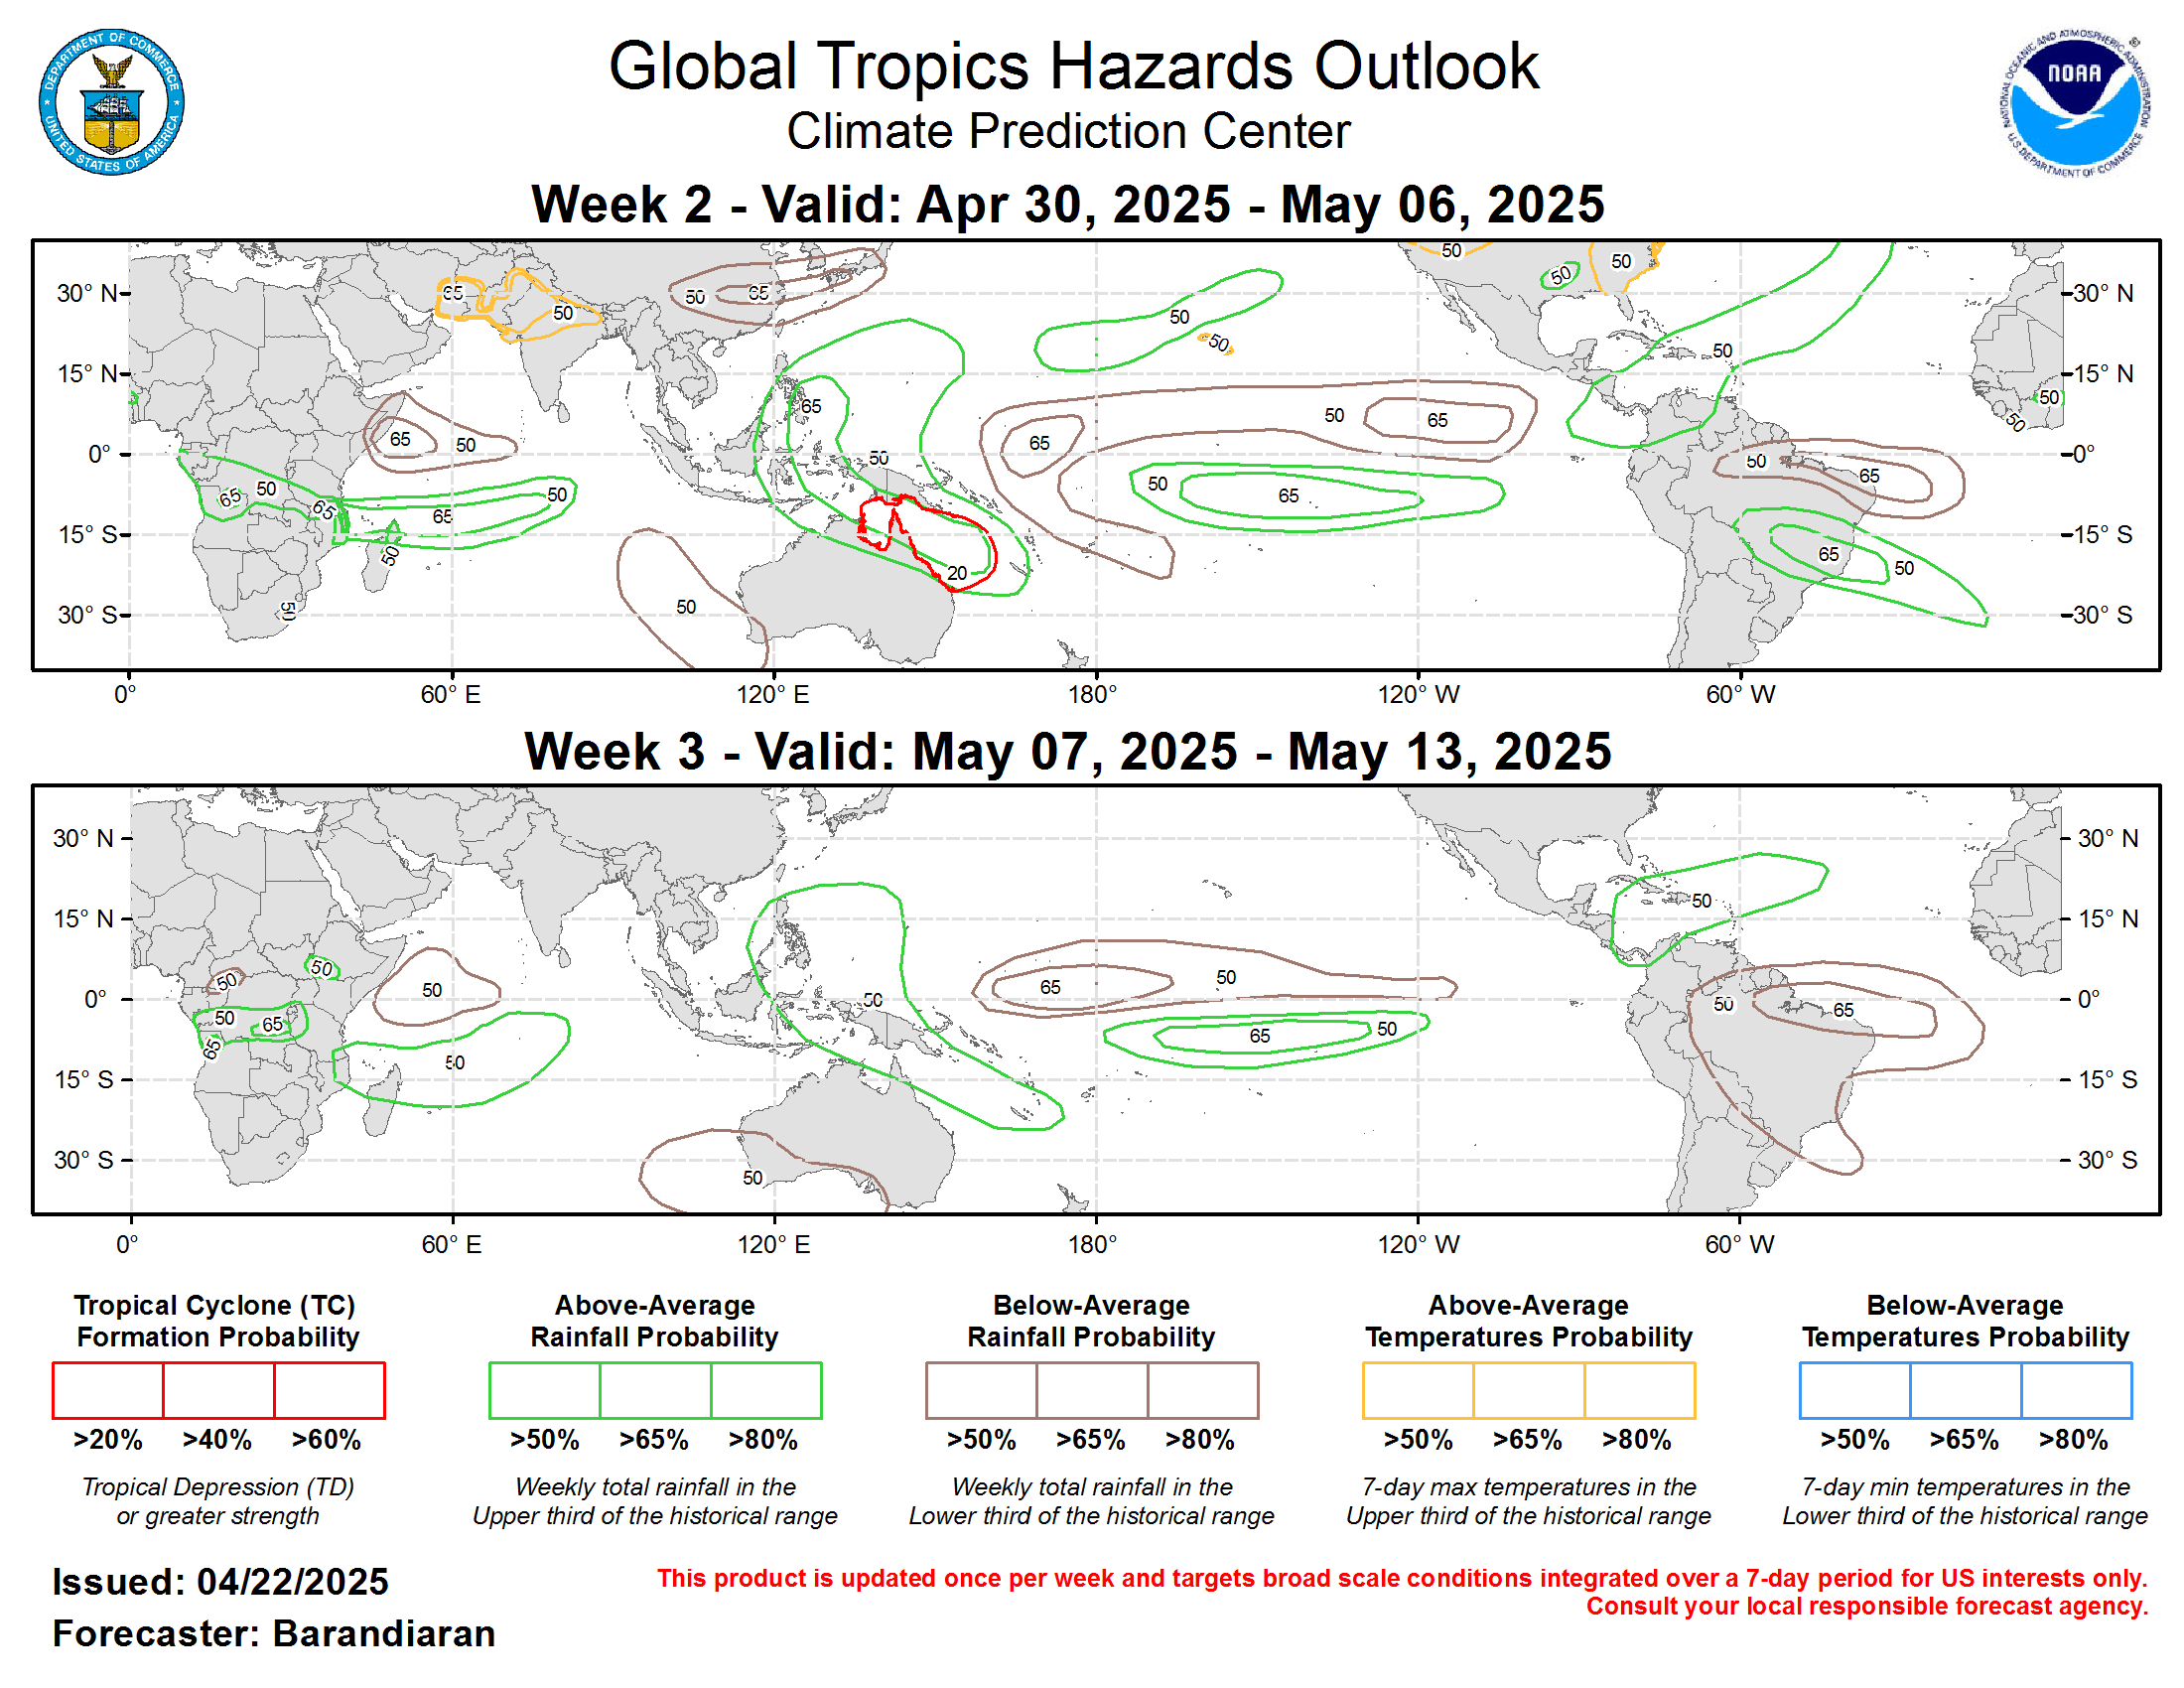
Since early September, the Madden Julian Oscillation (MJO) has remained weak and generally meandered near or within the RMM-based unit circle. An enhanced low frequency convective signal tied to La Nina has dominated across the Indian Ocean and Maritime Continent, with higher frequency Kelvin waves driving the convective pattern across the Western Hemisphere through periods of constructive and destructive interference with the base state. The GEFS and ECMWF ensembles are in good agreement depicting a MJO event taking shape across the Indian Ocean during the next week, and propagating eastward through the Maritime Continent toward the end of October (phases 3 through 5). This near-term evolution constructively interferes with the established low frequency base state, while also resulting in the suppressed convective phase strengthening across the Americas during the next 2 weeks. This favors continuing enhanced chances for tropical cyclone (TC) development across the Indian Ocean on either side of the Equator and the Western Pacific, with decreasing TC activity more likely across the Eastern Pacific and the Atlantic Basins.
Global TC activity was elevated across several basins during the past week. Across the Western Pacific, Typhoon Nakri formed on 10/8 and tracked to the southeast of Japan. Over the Eastern Pacific, Tropical Storm Raymond developed on 10/9, with its remnants making landfall across Baja California resulting in significant flooding over portions of Mexico. Subtropical Storm Karen was a short-lived system across the North Atlantic on 10/10, and is noteworthy as the highest latitude (44.5 deg N) TC formation across the Atlantic. Lastly, Tropical Storm Lorenzo formed over the Main Development Region of the Atlantic, and is forecast to recurve over open waters. The low frequency convective signal across the Eastern Hemisphere continues to favor additional TC development across the Indian Ocean on both sides of the Equator, and across the Western Pacific (Invest 96W) during week-1. Additionally, the National Hurricane Center (NHC) denotes a 60 percent chance for TC development over the Eastern Pacific in week-1.
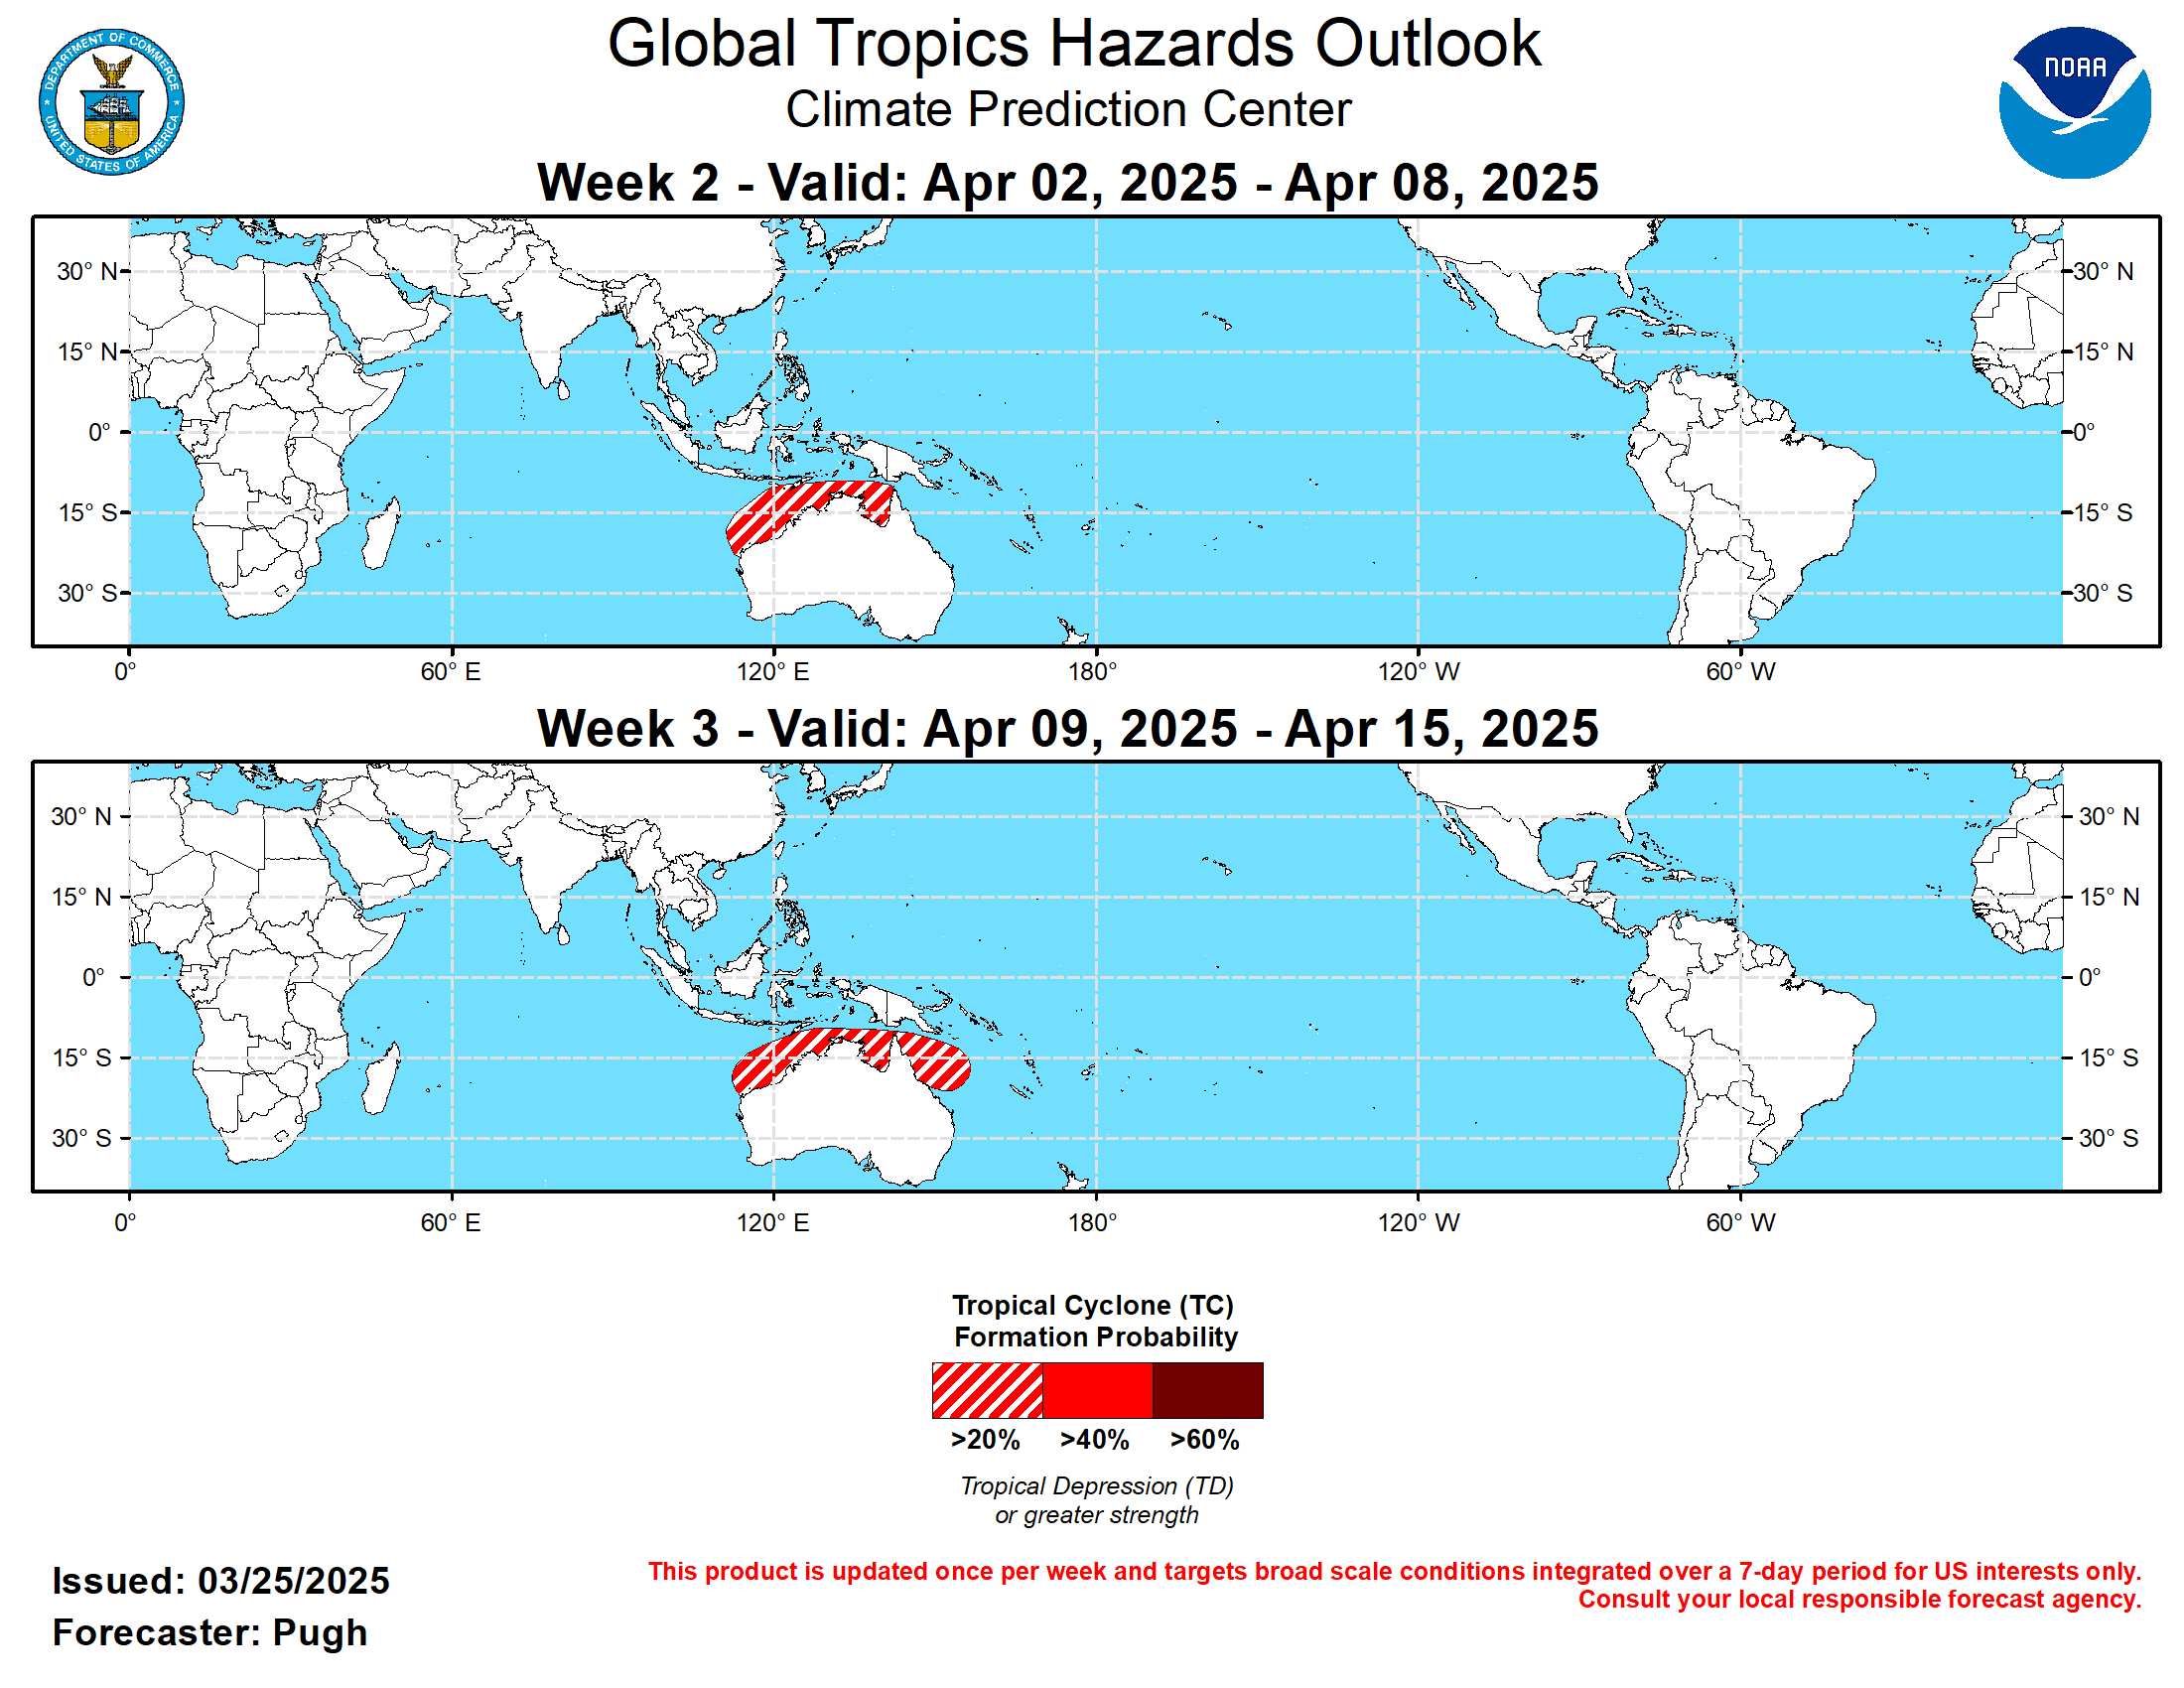
TC activity is forecast to remain elevated during week-2 across much of the Eastern Hemisphere as the MJO constructively interferes with the low frequency base state. TC development chances of 40-60 percent are highlighted across the Bay of Bengal, with 20-40 percent chances across the Arabian Sea and Southern Indian Ocean tied to a forecast low-level westerly wind burst across the Equatorial Indian Ocean which could trigger TC development on either side of the Equator. TC formation probabilities of 20-40 percent continue during week-3 across the Bay of Bengal and Southern Indian Ocean, although there is less confidence given the continued eastward propagation of the MJO. The MJO combined with climatology supports 40-60 percent chances of TC formation during weeks 2 and 3 over the Western Pacific.
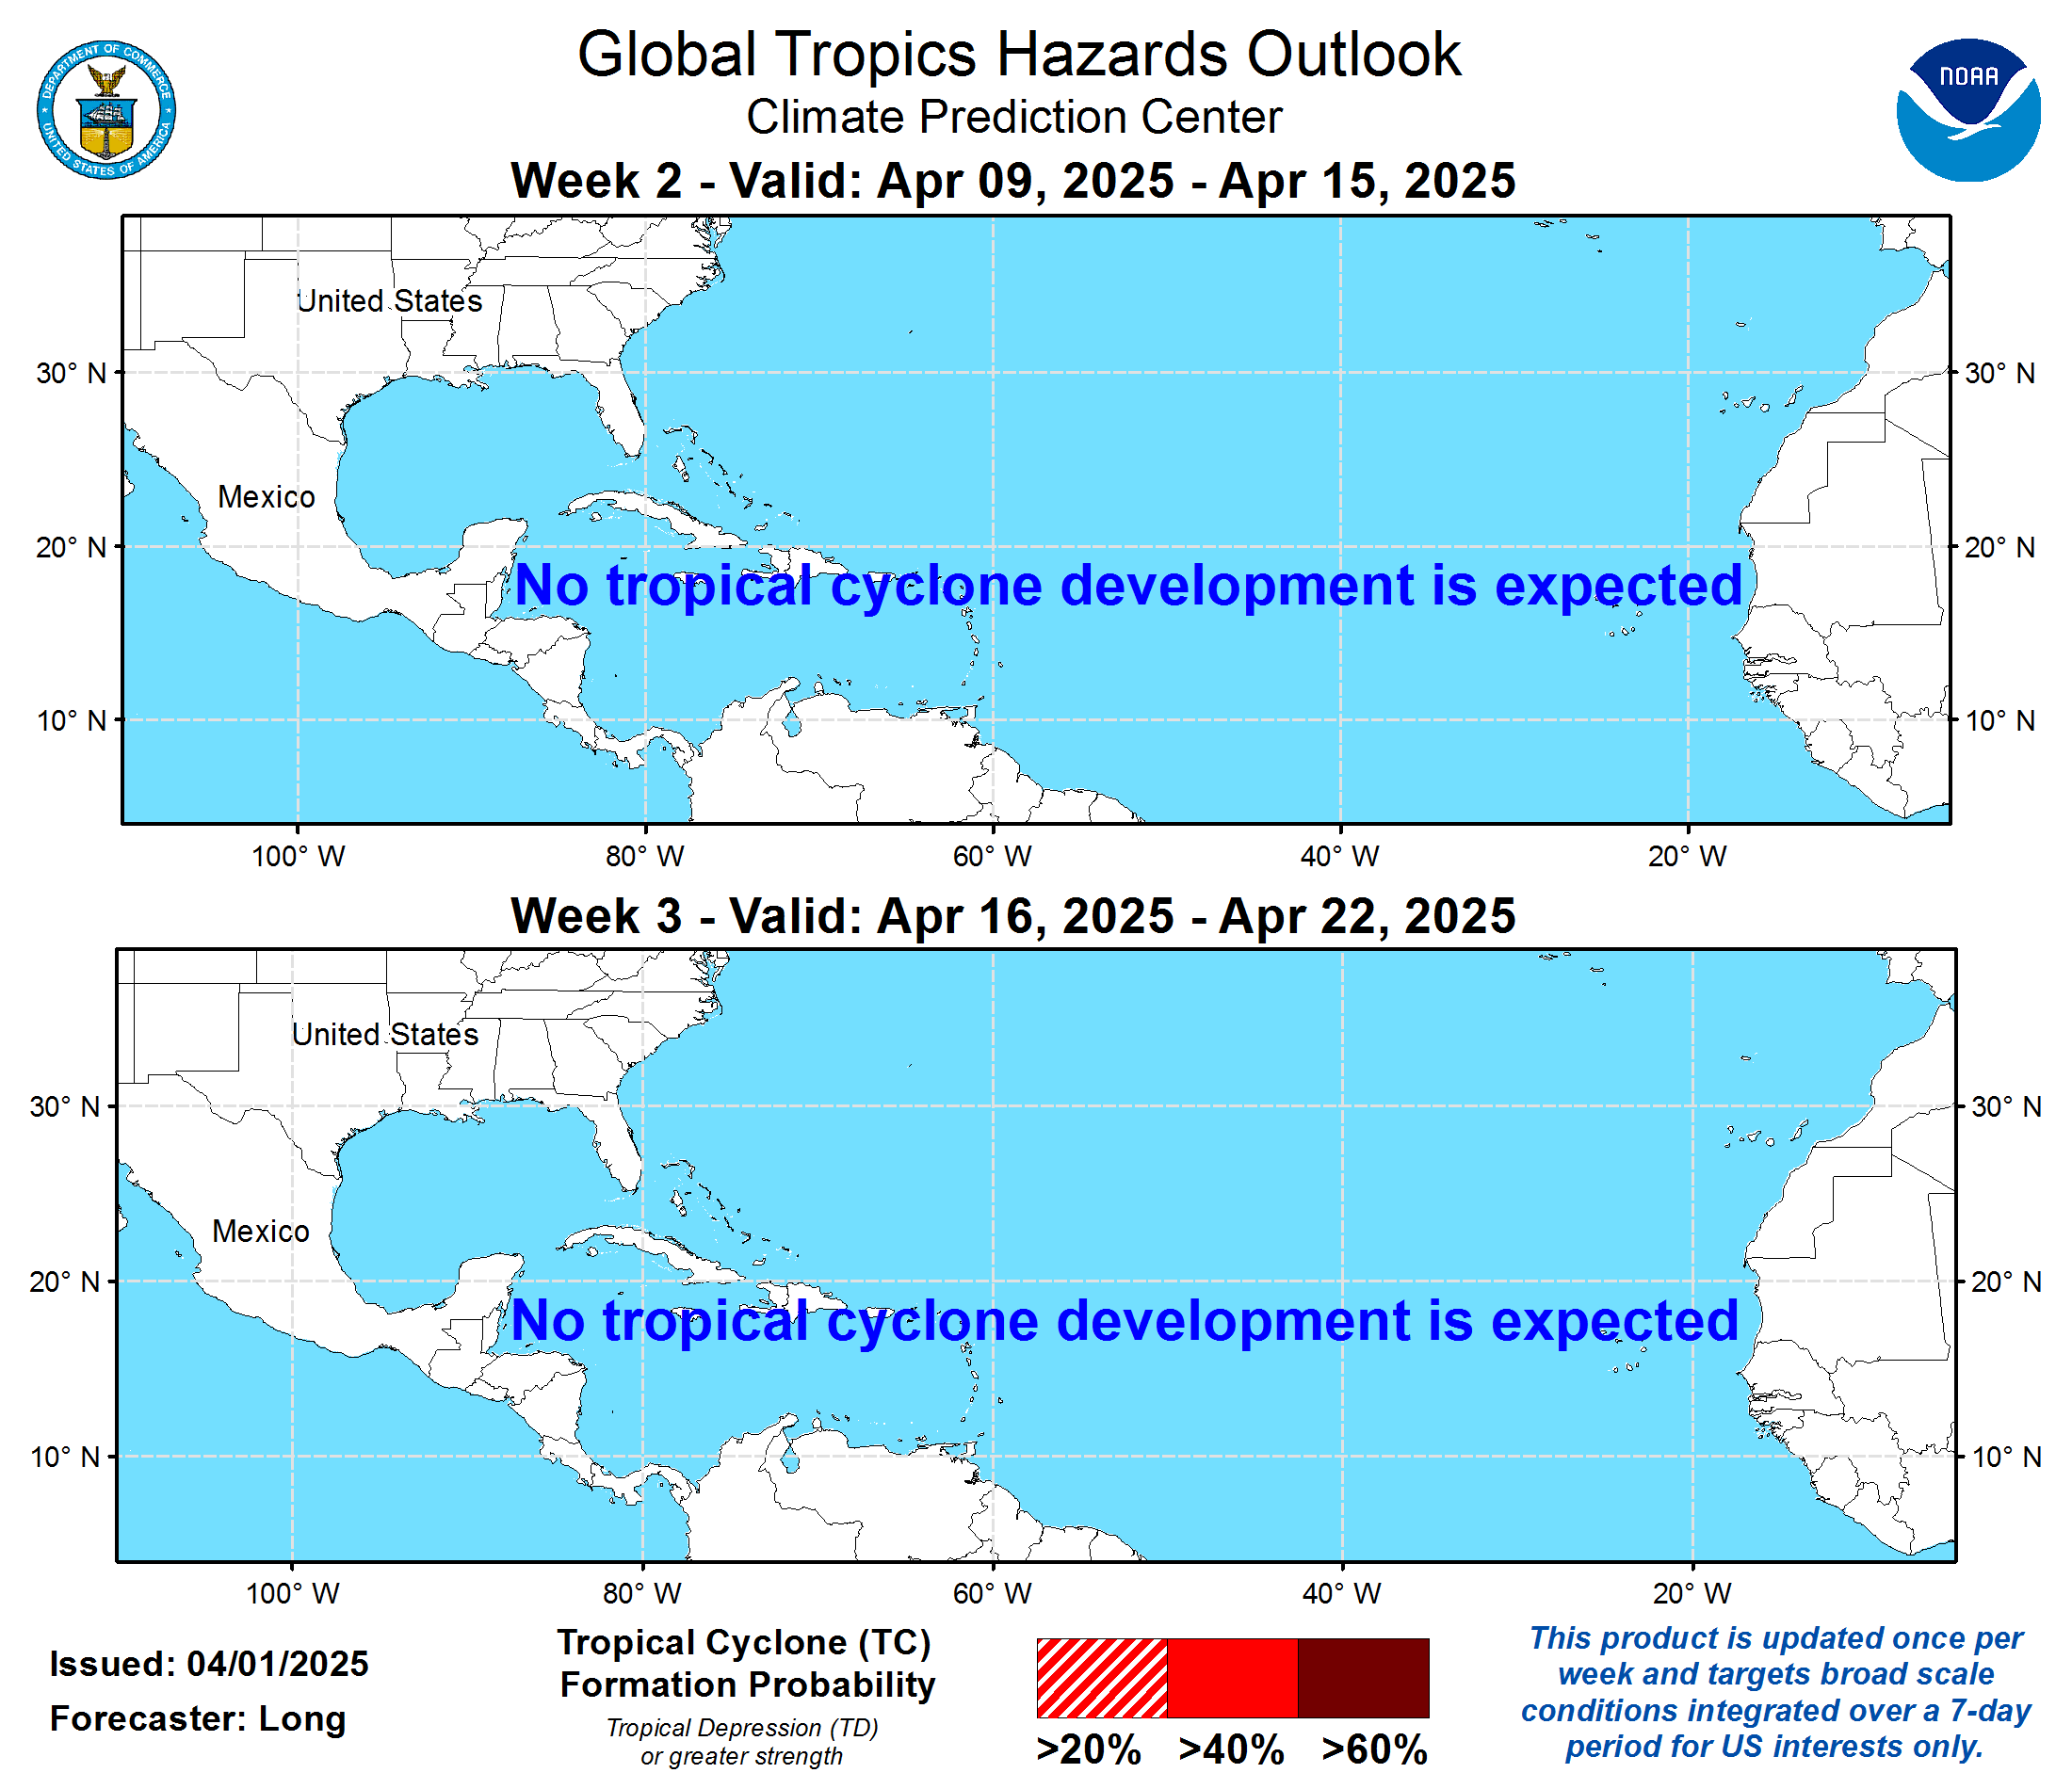
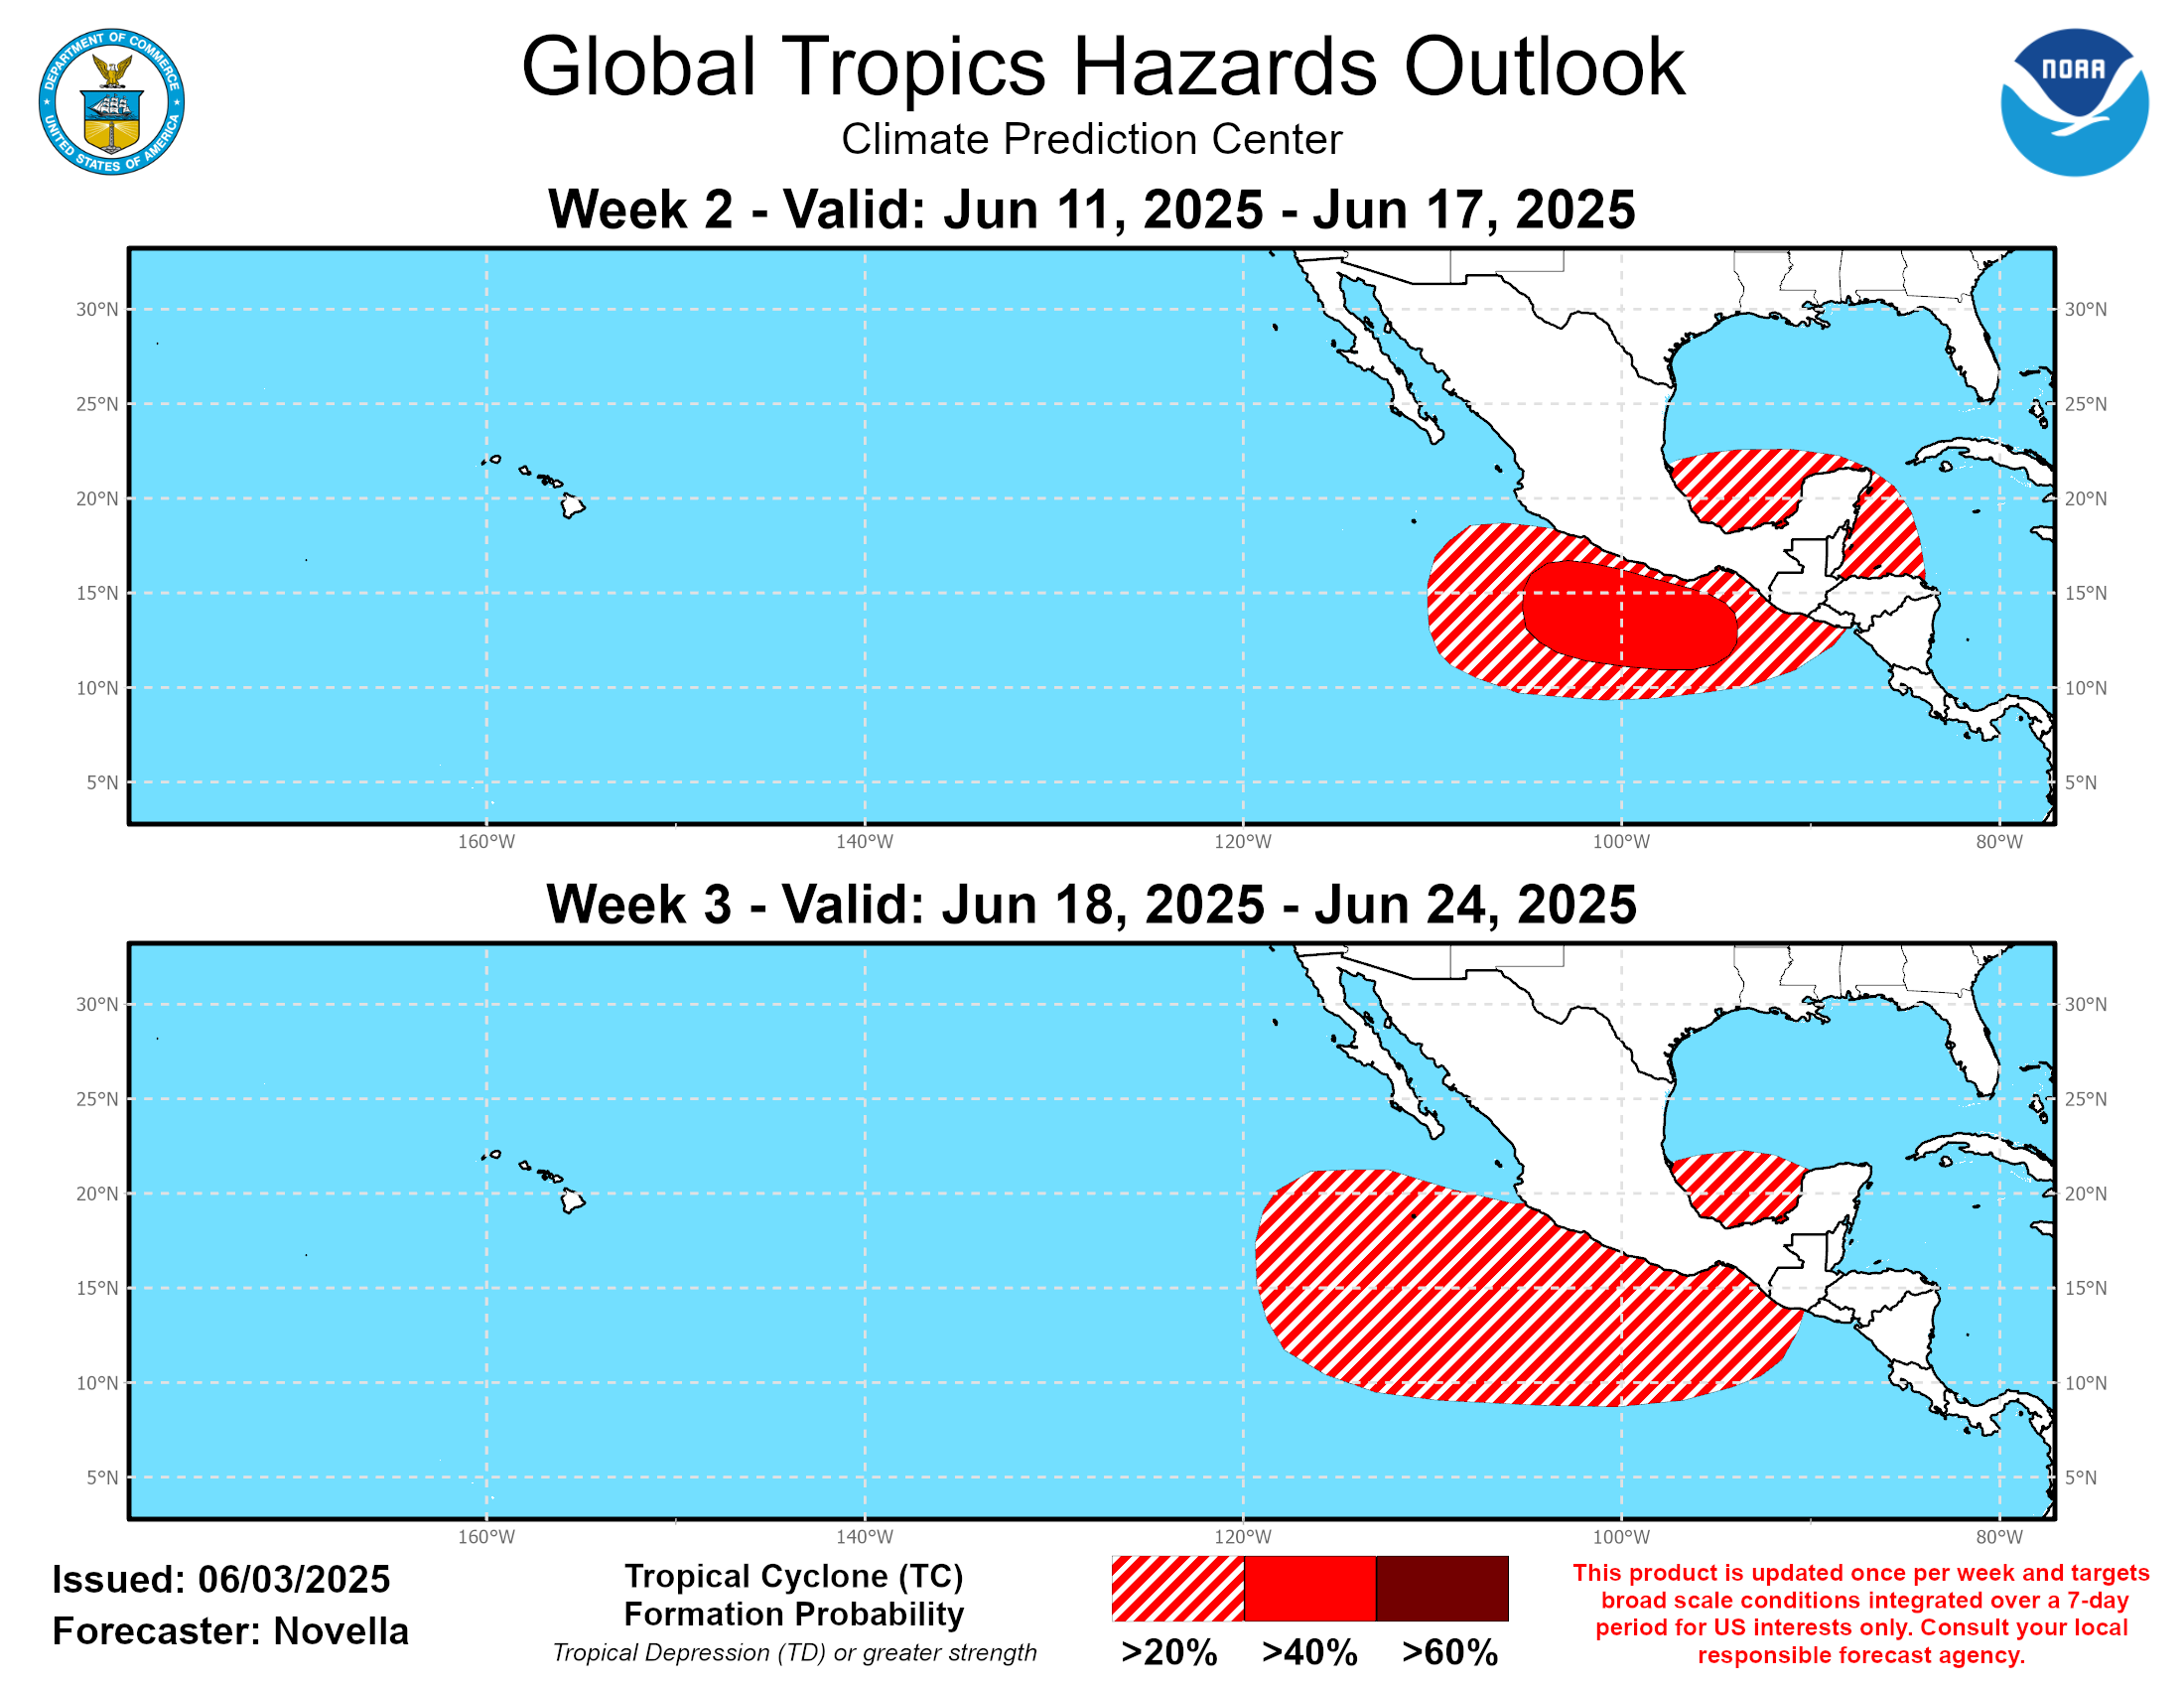
An easterly wave is forecast to traverse the Atlantic and reach the Caribbean around the outset of week-2. There is good model support for this system, although the speed and development is uncertain. The ECMWF ensemble has trended slower and develops it over the western Caribbean or Gulf of Honduras, while the GEFS is faster and depicts a system forming further east, possibly prior to the start of week-2. Given the good model agreement, 40-60 percent chances for TC development are indicated across the Caribbean for the outlook for week-2. Following this system, the suppressed phase of the MJO favors a lull in activity across both the Atlantic and Eastern Pacific basins. A 20-40 percent chance of TC formation area remains across the East Pacific to the south of Mexico for week-2 given the very active season, and potential for at least one additional system prior to the environment aloft becoming less favorable.
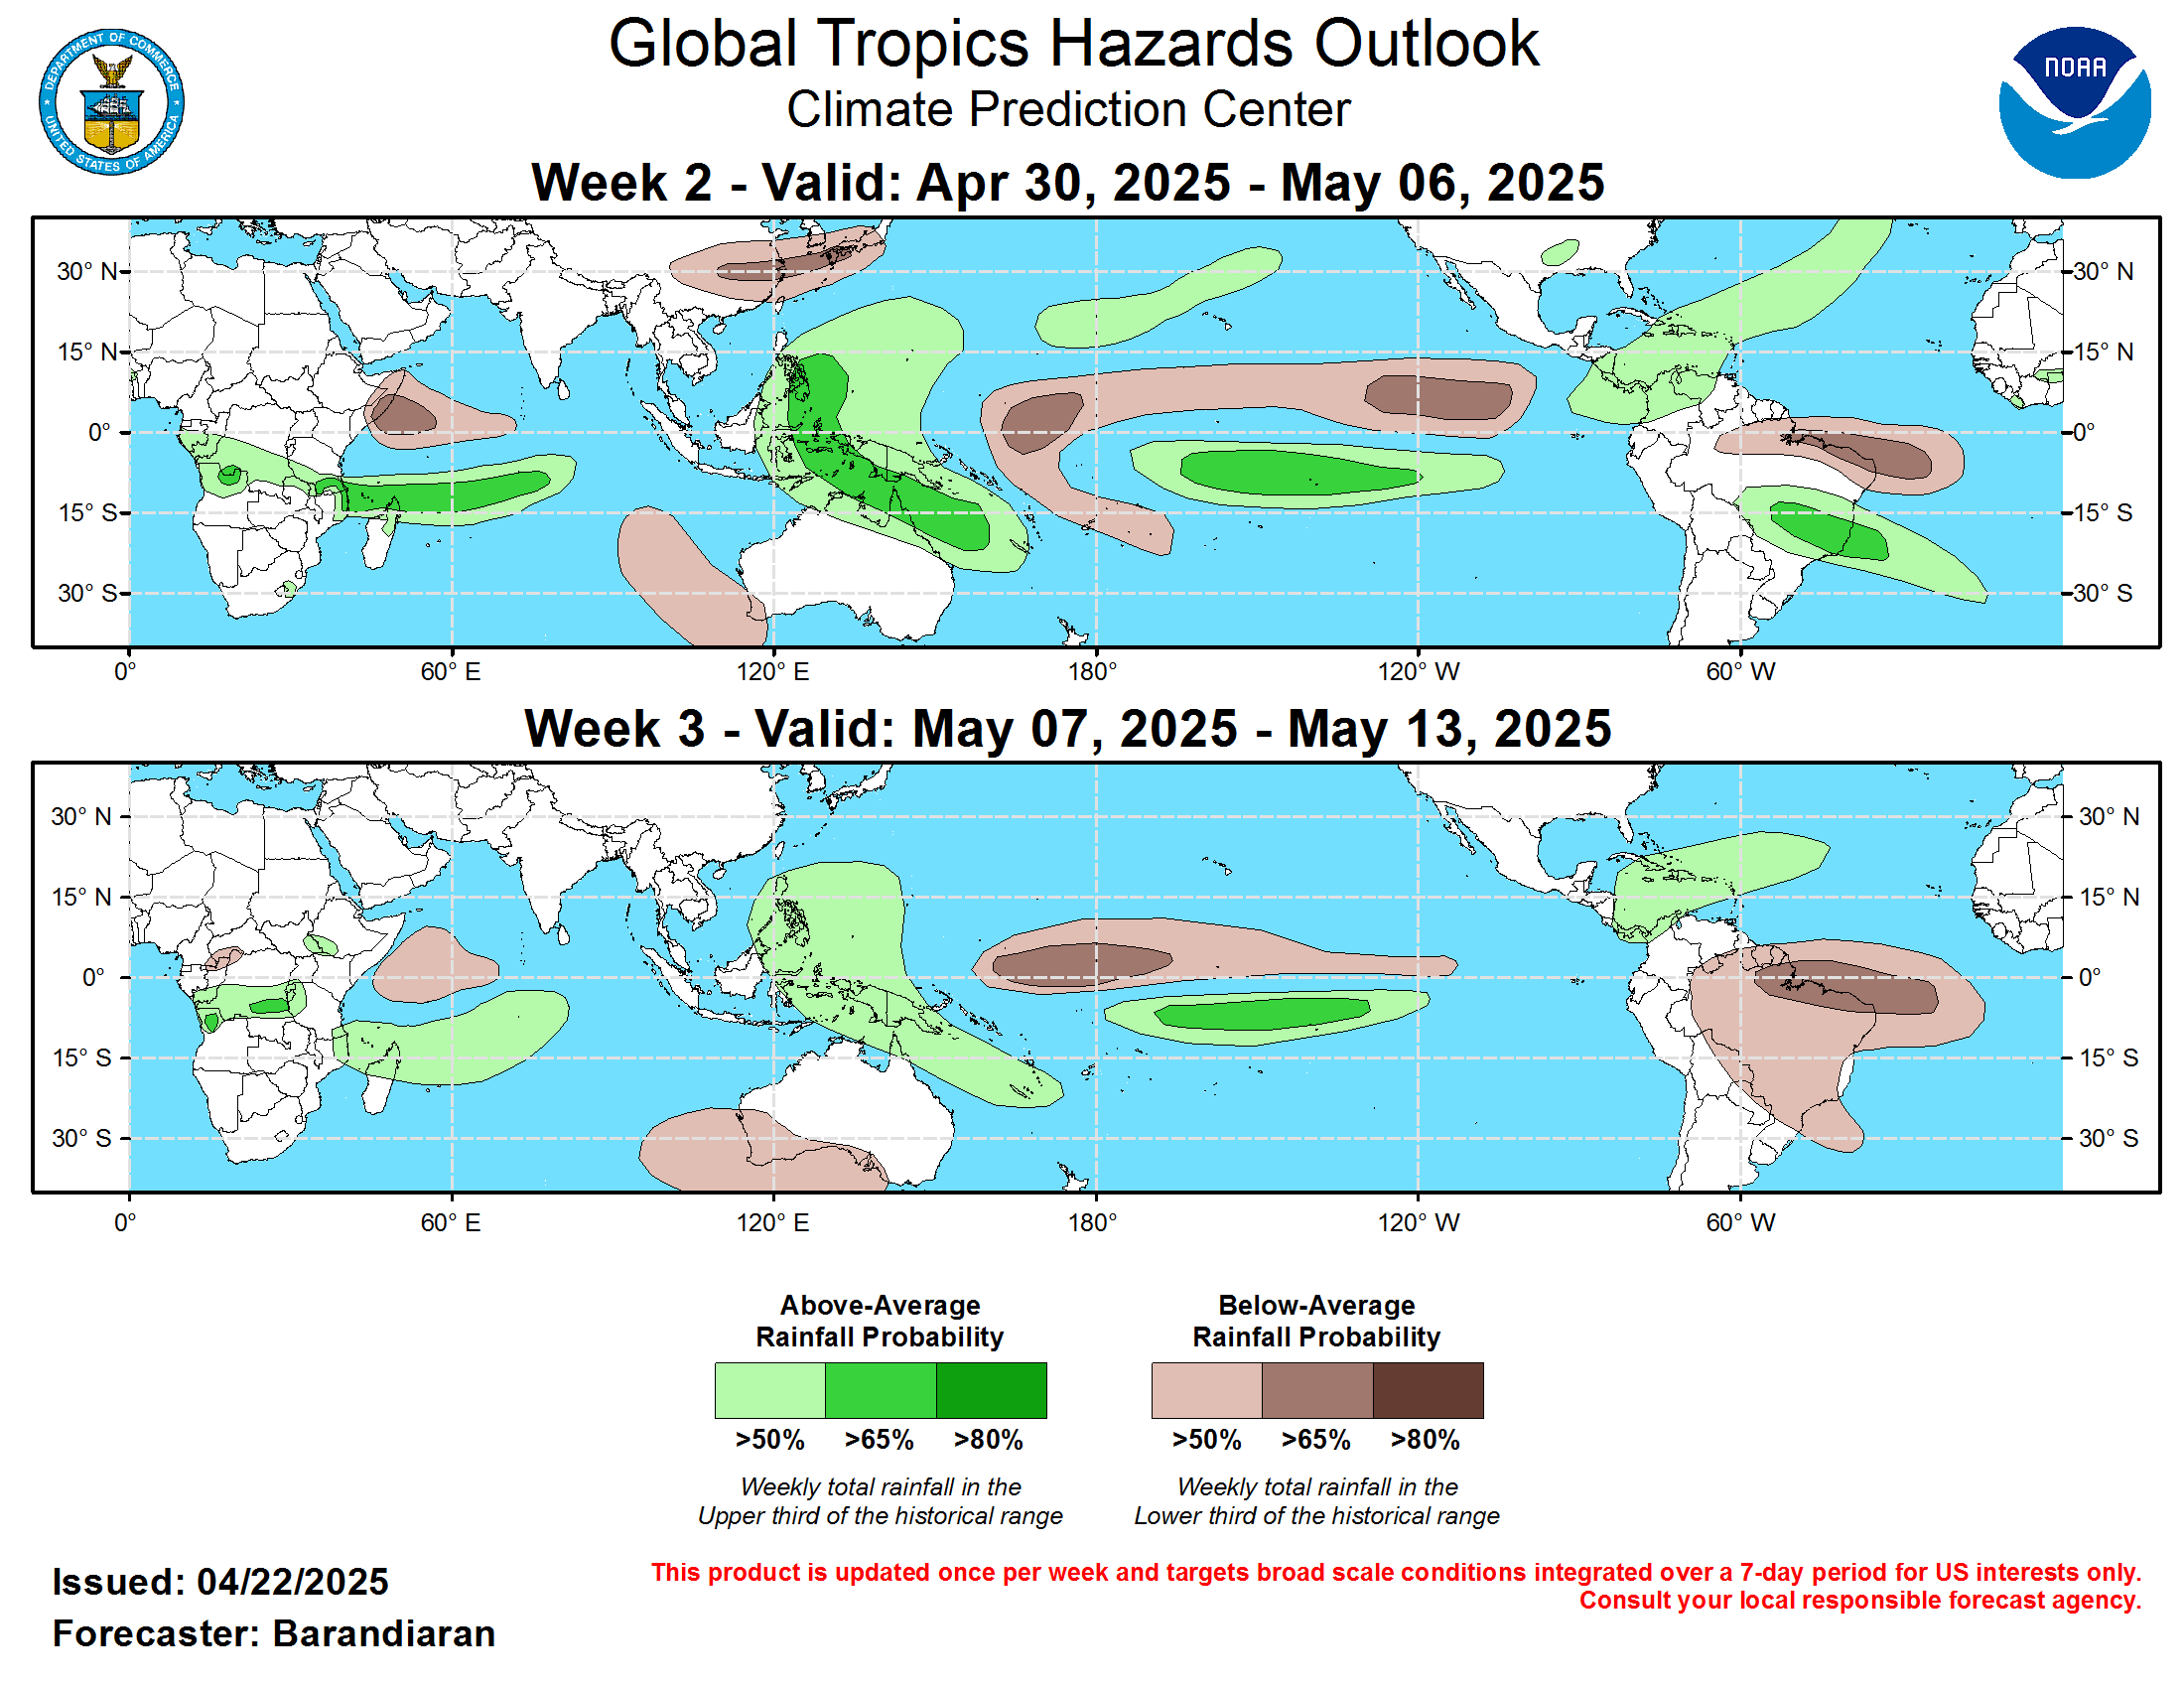
The precipitation outlook for weeks 2 and 3 is based on potential TC activity, the anticipated low frequency response, MJO composites, and informed by GEFS, CFS, Canadian, and ECMWF ensemble mean solutions. The MJO along with La Nina favors above-normal rainfall across much of southern India, southeastern Asia, and the Maritime Continent. Below-normal rainfall chances are forecast to expand across the Equatorial Indian Ocean during week-3 in the wake of a westerly wind burst and the MJO forcing shifting further east. Areas of below-normal rainfall are also predicted across the Pacific tied to a more suppressed convective environment aloft. The potential tropical system over the Caribbean tilts the odds toward above-normal rainfall across the western tropical Atlantic. For hazardous weather conditions in your area during the coming two-week period, please refer to your local NWS office, the Medium Range Hazards Forecast produced by the Weather Prediction Center, and the CPC Week-2 Hazards Outlook. Forecasts made over Africa are made in coordination with the International Desk at CPC.
|
Product Release Information
The Global Tropics Hazards Outlook (GTH) is released once per week every Tuesday at 1730 UTC (1830 UTC when on standard time) including U.S. federal holidays.
At the time of product release, there is a live briefing (available via Google Meet) open to all stakeholders where the latest conditions and the newly
released outlook are shared with the opportunity to ask questions. Folks that are interested in learning more or attending these briefings should contact
Jon.Gottschalck@noaa.gov, Scott.Handel@noaa.gov, Adam.Allgood@noaa.gov and Nicholas.Novella@noaa.gov for the required information. Each weekly outlook and GTH release briefing is
Archived and available on the website.
|
Product Description
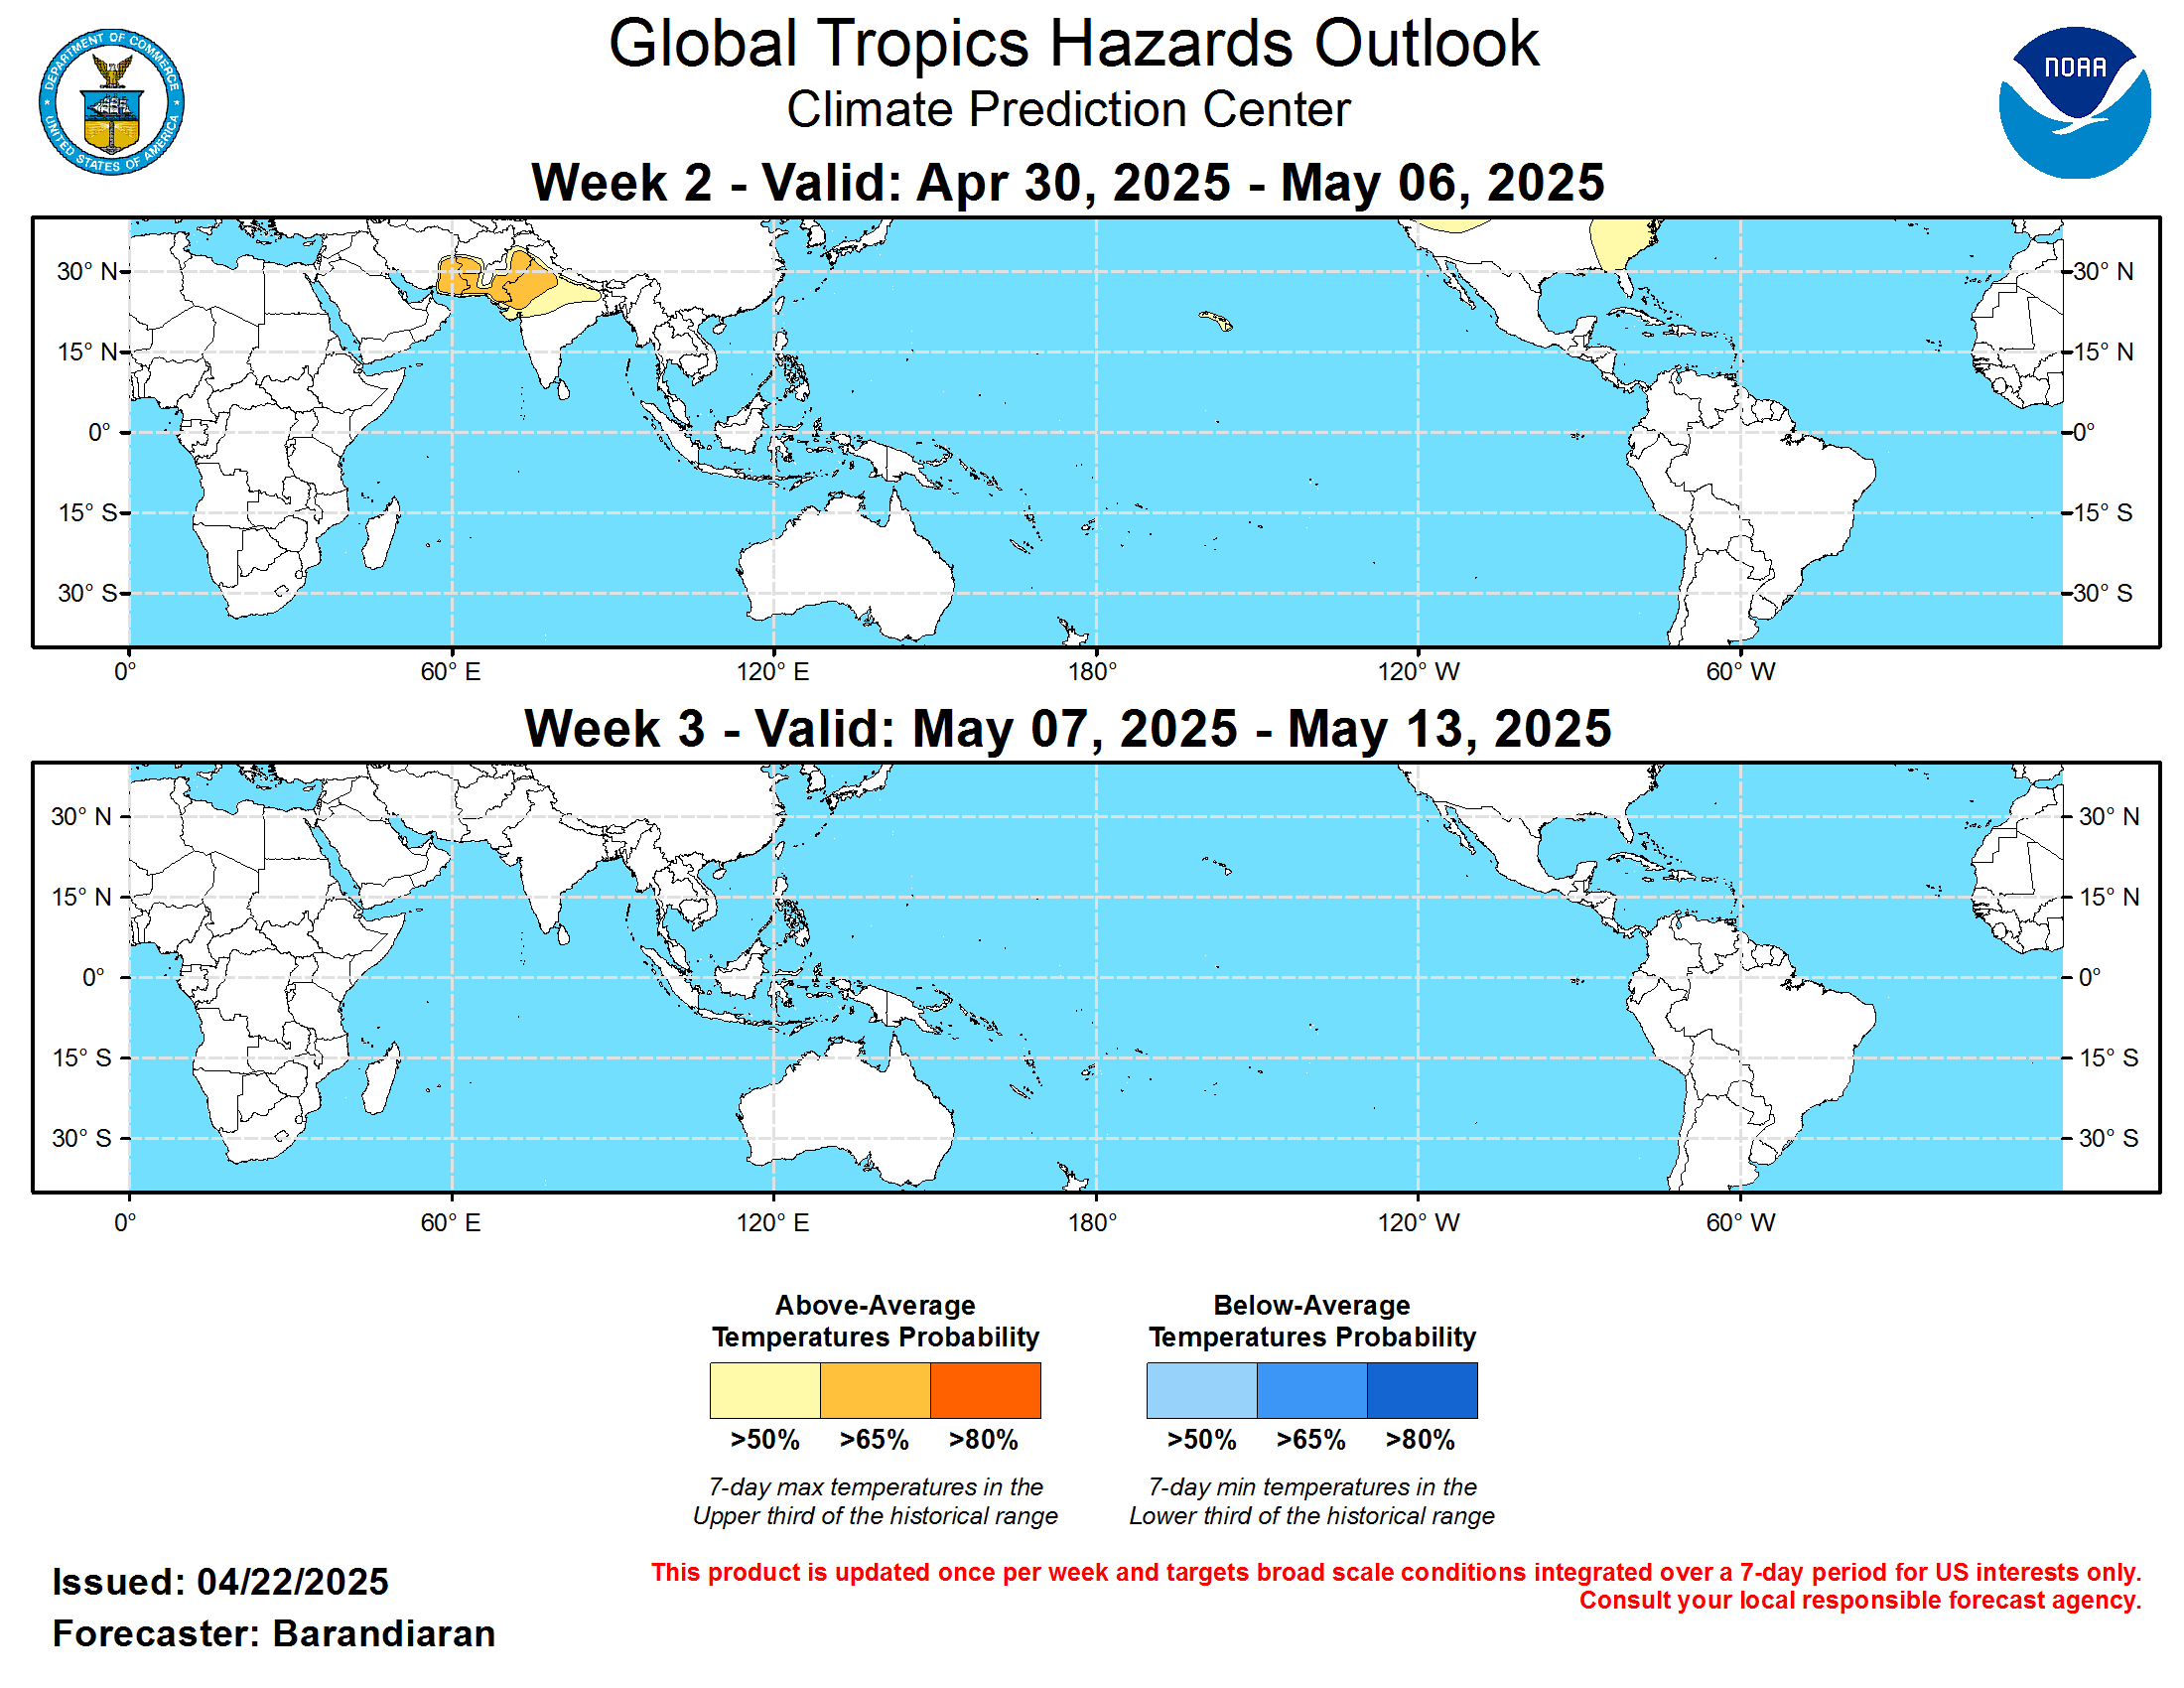
The Global Tropics Hazards Outlook is a probabilistic forecast for areas with elevated probabilities for above- or below-median rainfall, above- or below-normal
temperatures and regions where tropical cyclogenesis is favored for the upcoming Week-2 and Week-3 time periods. The rainfall outlook is for precipitation
integrated over a week and targets broad-scale patterns, not local conditions as they will be highly variable. Above (below) median rainfall forecast areas are
depicted in green and brown respectively. Above (below) normal temperature forecast areas are depicted in orange and blue respectively. Favored areas for tropical
development are shown in red. Three probability intervals are indicated for precipitation and temperature which are set at 50, 65, and 80%, while the probability
intervals for tropical cyclone development are set at 20, 40, and 60%. The weekly verification period ranges from 00 UTC Wednesday to 00 UTC the following
Wednesday.
Along with the product graphic, a written text outlook discussion is also included at release time. The narrative provides a review of the past week across
the global Tropics, a description of the current climate-weather situation, the factors and reasoning behind the depicted outlook and notes on any other
issues the user should be aware of. The discussion discusses the impacts in the Tropics as well as potential impacts in the Extratropics when relevant.
|
Product Physical Basis
The product synthesizes information and expert analysis related to climate variability across multiple time scales and from various sources, including operational
climate monitoring products. The physical basis for the outlooks include
El Nino-Southern Oscillation (ENSO) , the Madden-Julian Oscillation (MJO),
strength and variations of the monsoon systems, other coherent subseasonal tropical variability such as atmospheric Kelvin waves (KW), Equatorial Rossby waves
(ERW), African easterly waves, as well as interactions with the extratropical circulation (i.e. high latitude blocking, low-latitude frontal activity, etc.).
|
Product Forecast Tools
The outlook maps are currently based on a number of forecast tools, many of which are objective and serve as an objective first guess. The final depiction is an
assessment of these objective forecast tools augmented by the forecaster when based on additional forecast information when appropriate to create the final product.
Forecast tools include MJO composites, empirical and dynamical based MJO, ERW and KW forecasts, and bias-corrected dynamical model guidance from a number of modeling systems.
Tropical cyclone areas are based on MJO composites and statistical and dynamical tropical cyclone forecast guidance products as well as raw model forecast guidance.
|
Product Purpose
The product supports the NOAA mission in three primary ways:
- Assess and forecast important changes in the distribution of tropical convection (i.e., potential circulation changes across the Pacific and North America sectors) and communicate this information to NWS forecasters
- Provide advance notice of potential hazards related to climate, weather and hydrological events across the global tropics (including tropical cyclone risks for several NWS regions)
- Support various sectors of the U.S. economy (finance, energy, agriculture, water resource management) that have foreign interests.
|
Product Partners
The product is created through collaboration with other NOAA centers, [the National Hurricane Center (NHC) and the Central Pacific Hurricane
Center (CPHC)], the Department of Defense [The Joint Typhoon Warning Center (JTWC) and the Naval Postgraduate School (NPS)],
the Australian Bureau of Meteorology, Taiwan Central Weather Bureau, the State University of New York at Albany (SUNY) and the Center
for Climate and Satellites (CICS), among other collaborators.
|
Product Users and Applications
Known users include U.S. government agencies such as NOAA [National Weather Service (NWS), River Forecast Centers (RFCs), the National
Marine Fisheries Service (NMFS), the Department of the Interior (U.S. Forest Service), aid organizations (U.S. and international Red Cross,
USAID), domestic and global private sector interests (financial, energy, water resource management and agricultural sectors),
international weather services and various media meteorologists.
Some special applications of the product in the past include extended range predictions to support Haiti earthquake and Deepwater
Horizon oil spill relief efforts as well as support for the Dynamics of the MJO (DYNAMO) scientific field campaign held from
October 2011 through March 2012.
|
Product Resources
|
|
Feedback and Questions
|
|


