|
|
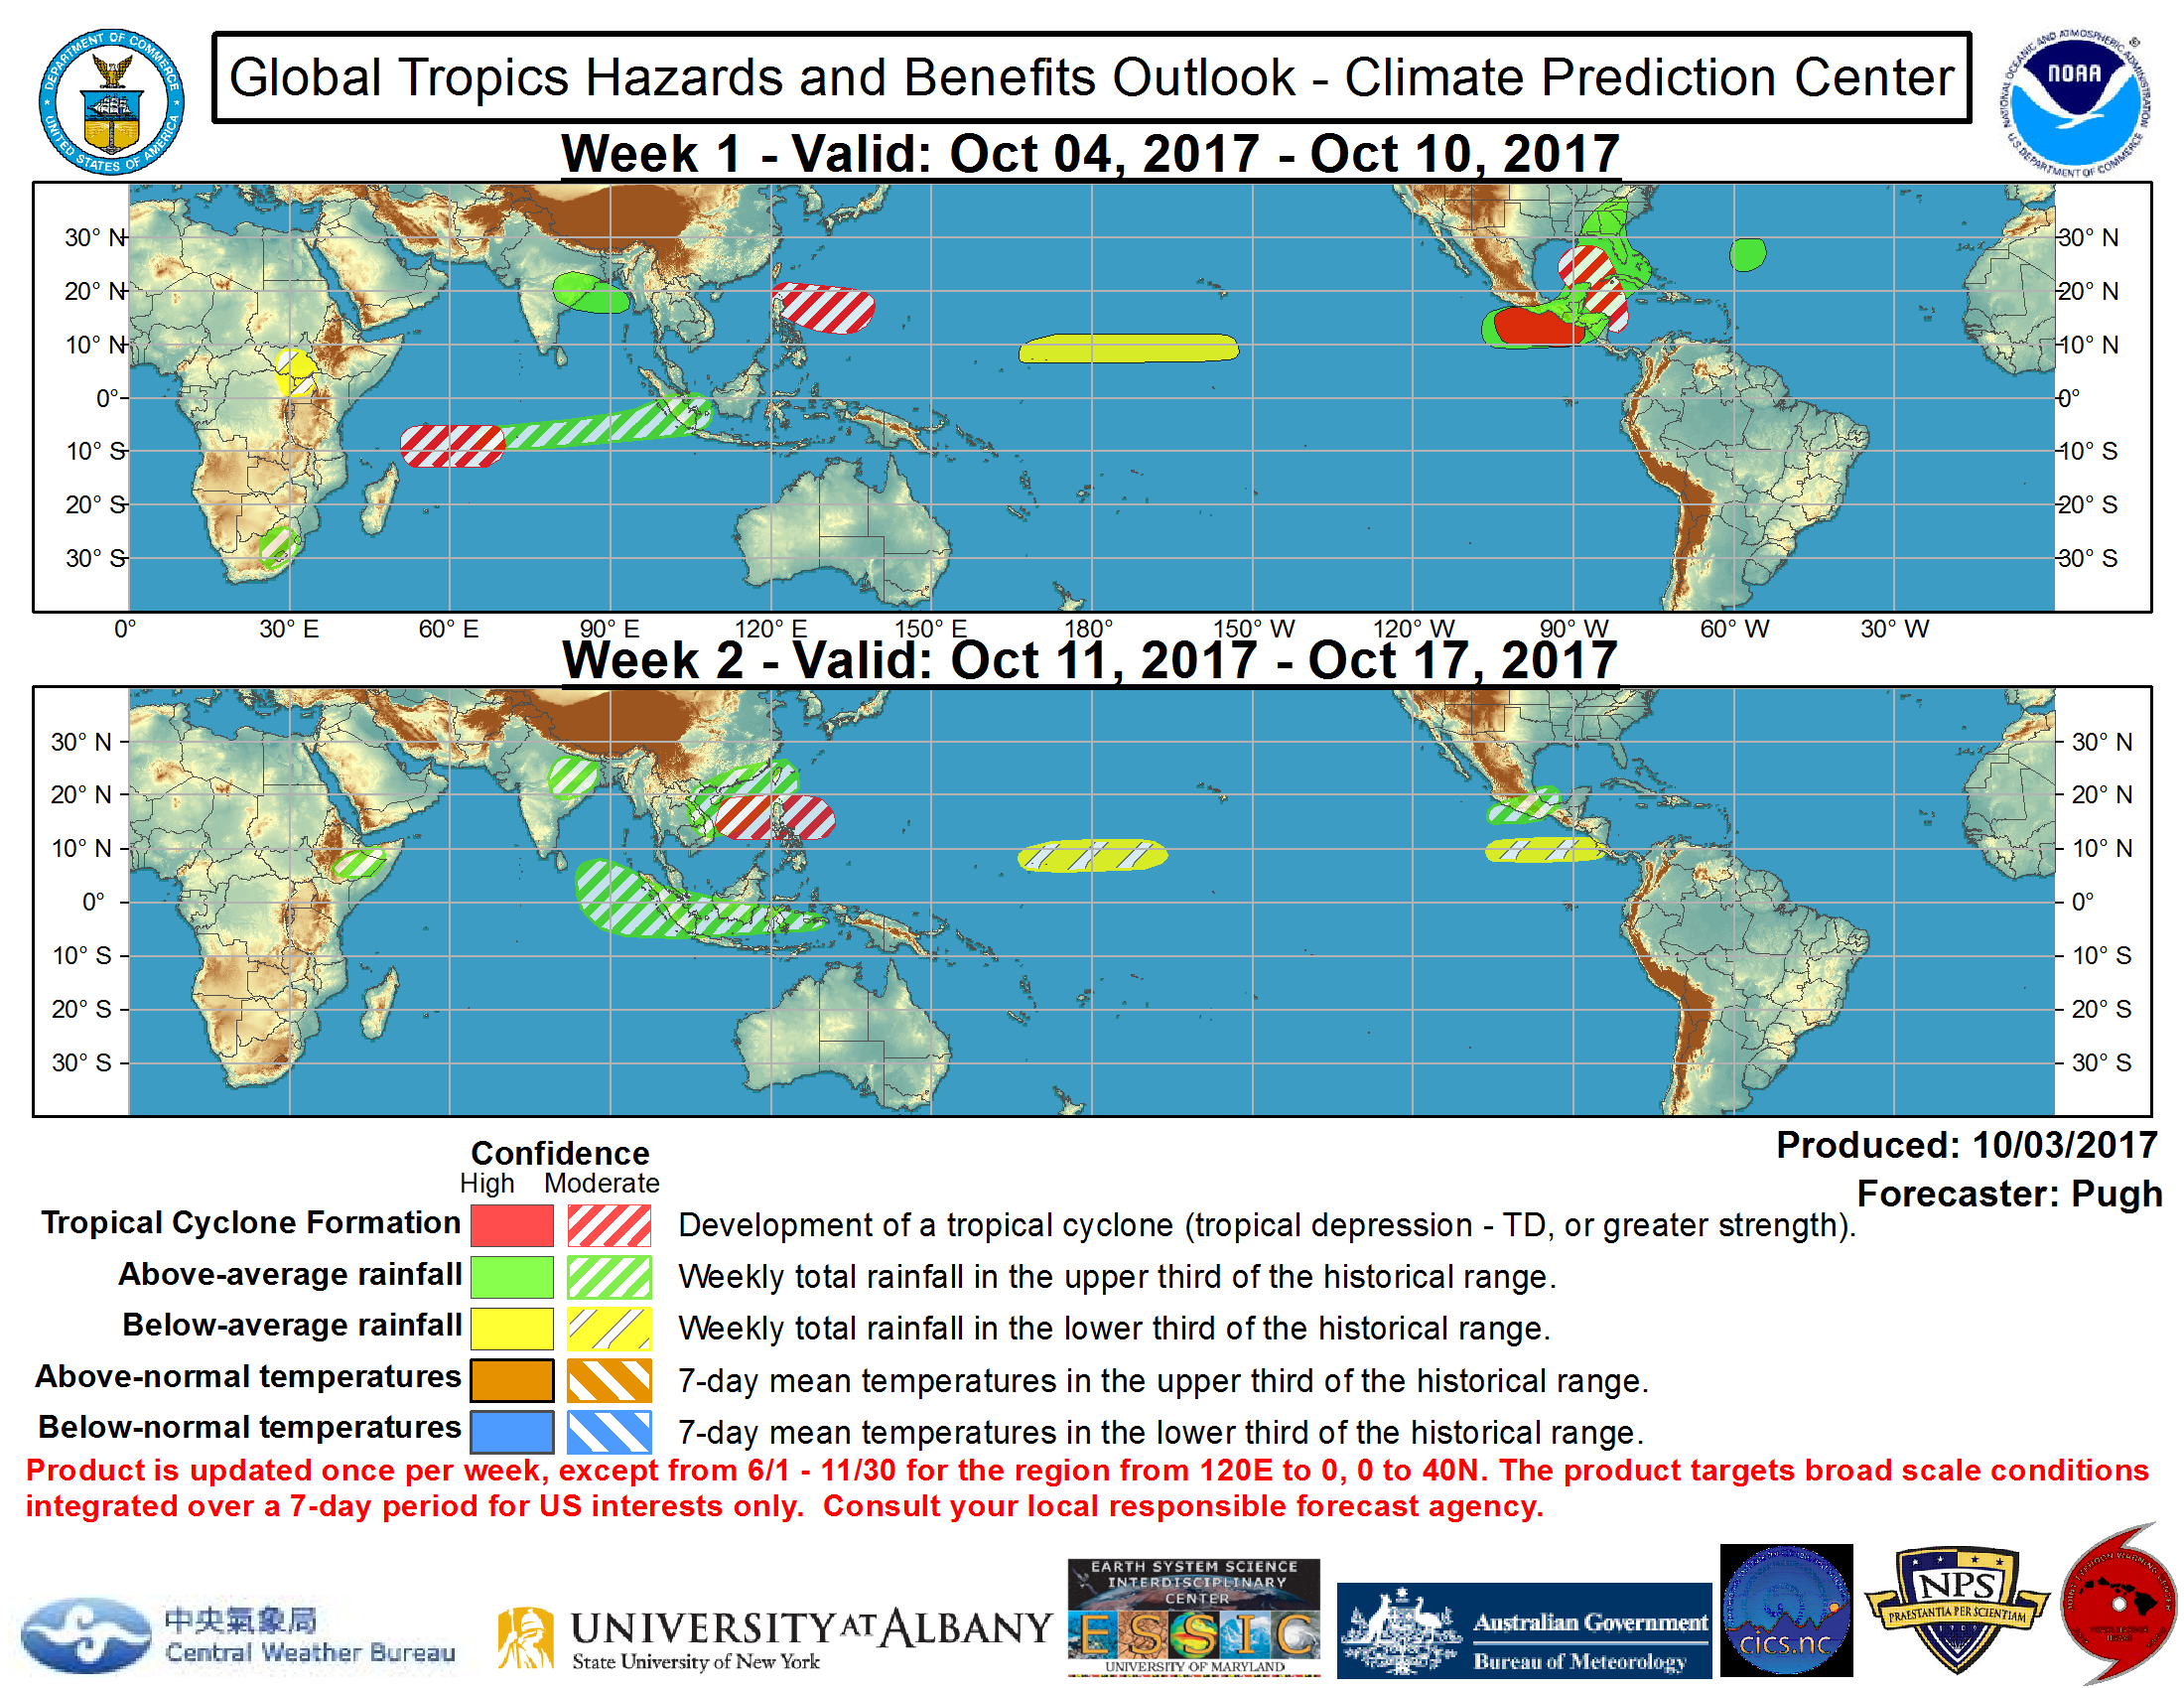
GTH Outlook Map and Data
|
Last Updated -
05/06/25
|
|
|
|
|
|
GTH Outlook Discussion
|
Last Updated -
05/06/25
|
Valid -
05/14/25 - 05/27/25
|
Since late April, RMM observations depict the MJO signal propagating from the Western Pacific into the Western Hemisphere suggestive of subseasonal activity becoming better organized. However, this eastward propagation is likely tied to a reversal of the convective and circulation anomalies isolated to the eastern Indian Ocean during the past week, where the rest of the global tropics continues to reflect a mixed anomaly spatial structure, inconsistent with a reorganizing MJO. With the RMM based signal losing amplitude and returning within the unit circle within the last few days, this short-lived behavior falls more in line with higher frequency tropical modes remaining at play. Moreover, objective wave filtering of upper-level velocity potential anomalies in Hovmoeller space indicate that much of the tropics has been dominated by equatorial Kelvin wave activity, with little evidence for sustained or robust MJO activity since late March. Based on RMM and velocity potential forecasts, fast propagating equatorial Kelvin wave activity looks to continue during the next few weeks, where models are largely unsupportive of a coherent MJO reemerging later in May. The absence of large-scale, coherent tropical forcing, combined with ENSO neutral conditions leads to added forecast uncertainty, as the updated outlook relies mostly on dynamical model guidance for areas of enhanced/suppressed precipitation and tropical cyclogenesis. Low odds for tropical cyclone (TC) development are favored during the period, though it is worth noting that there is growing support in the probabilistic tools for genesis in the Western Hemisphere as the outlook periods enter the Eastern Pacific Hurricane season.
Consistent with the annual minimum in the global TC genesis climatology for late April and early May, no TCs formed during the last seven days, with the last TC having formed back on April 18. Looking ahead, conditions over the northeastern Indian Ocean are expected to become more favorable for development during week-2 tied to an approaching equatorial Rossby Wave from the Western Pacific. 20% chances are posted in the eastern Bay of Bengal based on continued support in the probabilistic tools and an uptick in climatology for the basin during mid-May. Although the ECMWF remains unsupportive of development in the Western Pacific, 20% chances are also posted in the Philippine Sea for week-2, based on elevated signals in the GEFS probabilistic genesis tool with several ensemble members in the latest runs now favoring a higher number of deepening lows in highlighted area. South of the equator, probabilistic tools also point to increased chances for development to the north of Australia and over the South Pacific. However, no shapes are posted mainly due to the waning climatology for week-2, as any development also appears to be more probable during week-1
Given the lack of a coherent MJO in the extended range guidance, ENSO neutral conditions, and global TC climatology remaining relatively low, there are no TC areas highlighted for week-3. Early season TC formation is possible in the Eastern Pacific associated with continued Kelvin wave activity and the development of anomalous lower-level westerlies to the south of Mexico and extending into the Caribbean. The GEFS is more in favor of this potential, but due to the weaker ECMWF and uncertainty in regards to variable phase speeds of Kelvin wave passages in the ensemble members at this lead, there is not enough confidence to warrant any TC areas at this time. This area will continue to be monitored in upcoming outlooks.
As noted above, forecasts for enhanced and suppressed precipitation are primarily based on historical skill weighted blend of GEFS, ECMWF, and CFSv2 dynamical model guidance and anticipated TC tracks, with very little consideration from seasonal MJO and ENSO composites. Based on bias-corrected and calibrated temperature tools, there are elevated chances for above-normal temperatures and excessive heat conditions possible over the African Sahel and neighboring Sahara, as well as over portions of southwestern Asia and South America during week-2. Both above- and below-normal temperatures are also favored across the CONUS tied to an amplified trough/ridge pattern. For hazardous weather concerns in your area during the next two weeks, please refer to your local NWS office, the Medium Range Hazards Forecasts produced by the Weather Prediction Center, and the CPC Week-2 Hazards Outlook. Forecasts issued over Africa are made in coordination with the International Desk at CPC.
|
Product Release Information
The Global Tropics Hazards Outlook (GTH) is released once per week every Tuesday at 1730 UTC (1830 UTC when on standard time) including U.S. federal holidays.
At the time of product release, there is a live briefing (available via Google Meet) open to all stakeholders where the latest conditions and the newly
released outlook are shared with the opportunity to ask questions. Folks that are interested in learning more or attending these briefings should contact
Jon.Gottschalck@noaa.gov, Scott.Handel@noaa.gov, Adam.Allgood@noaa.gov and Nicholas.Novella@noaa.gov for the required information. Each weekly outlook and GTH release briefing is
Archived and available on the website.
|
Product Description
The Global Tropics Hazards Outlook is a probabilistic forecast for areas with elevated probabilities for above- or below-median rainfall, above- or below-normal
temperatures and regions where tropical cyclogenesis is favored for the upcoming Week-2 and Week-3 time periods. The rainfall outlook is for precipitation
integrated over a week and targets broad-scale patterns, not local conditions as they will be highly variable. Above (below) median rainfall forecast areas are
depicted in green and brown respectively. Above (below) normal temperature forecast areas are depicted in orange and blue respectively. Favored areas for tropical
development are shown in red. Three probability intervals are indicated for precipitation and temperature which are set at 50, 65, and 80%, while the probability
intervals for tropical cyclone development are set at 20, 40, and 60%. The weekly verification period ranges from 00 UTC Wednesday to 00 UTC the following
Wednesday.
Along with the product graphic, a written text outlook discussion is also included at release time. The narrative provides a review of the past week across
the global Tropics, a description of the current climate-weather situation, the factors and reasoning behind the depicted outlook and notes on any other
issues the user should be aware of. The discussion discusses the impacts in the Tropics as well as potential impacts in the Extratropics when relevant.
|
Product Physical Basis
The product synthesizes information and expert analysis related to climate variability across multiple time scales and from various sources, including operational
climate monitoring products. The physical basis for the outlooks include
El Nino-Southern Oscillation (ENSO) , the Madden-Julian Oscillation (MJO),
strength and variations of the monsoon systems, other coherent subseasonal tropical variability such as atmospheric Kelvin waves (KW), Equatorial Rossby waves
(ERW), African easterly waves, as well as interactions with the extratropical circulation (i.e. high latitude blocking, low-latitude frontal activity, etc.).
|
Product Forecast Tools
The outlook maps are currently based on a number of forecast tools, many of which are objective and serve as an objective first guess. The final depiction is an
assessment of these objective forecast tools augmented by the forecaster when based on additional forecast information when appropriate to create the final product.
Forecast tools include MJO composites, empirical and dynamical based MJO, ERW and KW forecasts, and bias-corrected dynamical model guidance from a number of modeling systems.
Tropical cyclone areas are based on MJO composites and statistical and dynamical tropical cyclone forecast guidance products as well as raw model forecast guidance.
|
Product Purpose
The product supports the NOAA mission in three primary ways:
- Assess and forecast important changes in the distribution of tropical convection (i.e., potential circulation changes across the Pacific and North America sectors) and communicate this information to NWS forecasters
- Provide advance notice of potential hazards related to climate, weather and hydrological events across the global tropics (including tropical cyclone risks for several NWS regions)
- Support various sectors of the U.S. economy (finance, energy, agriculture, water resource management) that have foreign interests.
|
Product Partners
The product is created through collaboration with other NOAA centers, [the National Hurricane Center (NHC) and the Central Pacific Hurricane
Center (CPHC)], the Department of Defense [The Joint Typhoon Warning Center (JTWC) and the Naval Postgraduate School (NPS)],
the Australian Bureau of Meteorology, Taiwan Central Weather Bureau, the State University of New York at Albany (SUNY) and the Center
for Climate and Satellites (CICS), among other collaborators.
|
Product Users and Applications
Known users include U.S. government agencies such as NOAA [National Weather Service (NWS), River Forecast Centers (RFCs), the National
Marine Fisheries Service (NMFS), the Department of the Interior (U.S. Forest Service), aid organizations (U.S. and international Red Cross,
USAID), domestic and global private sector interests (financial, energy, water resource management and agricultural sectors),
international weather services and various media meteorologists.
Some special applications of the product in the past include extended range predictions to support Haiti earthquake and Deepwater
Horizon oil spill relief efforts as well as support for the Dynamics of the MJO (DYNAMO) scientific field campaign held from
October 2011 through March 2012.
|
Product Resources
|
|
Feedback and Questions
|
|


