 |
Thermistor Chain Data
NOAA/NWS/NDBC
OCTOBER 2009
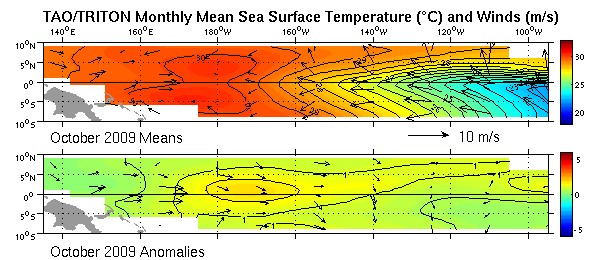
FIGURE A1.2
Wind Vectors and sea surface temperature (SSTs) from the TAO/TRITON
mooring array. Top panel shows monthly means; bottom panel shows monthly
anomalies from the COADS wind climatology and Reynolds SST climatology (1971-2000).
The TAO/TRITON array is presently supported by the United States (NOAA),
Japan (STA), and France (IRD). Further information is available from Richard L. Crout (NOAA/NDBC).
|
 |


