|
Height-Longitude Section
APRIL 2012
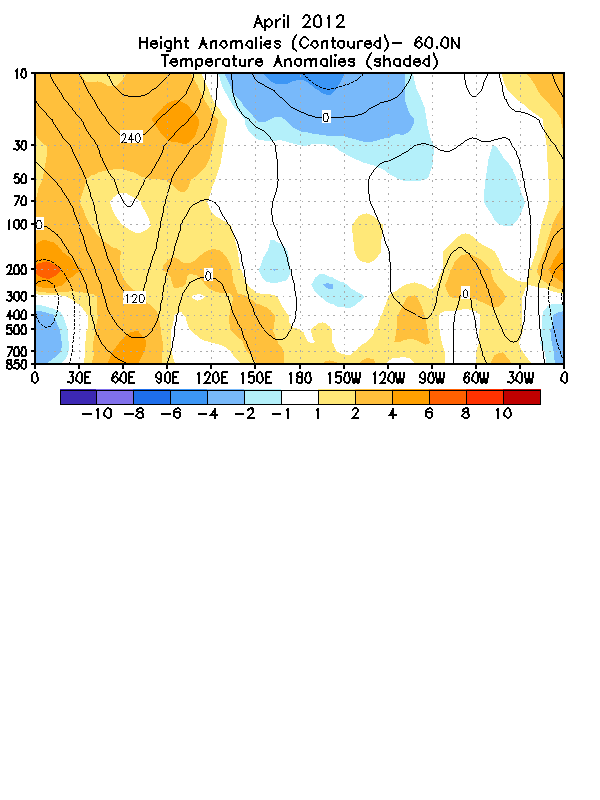
FIGURE S2.
Height-longitude sections at 60S for height anomalies
(contour) and temperature anomalies (shaded).
Contour interval for height
anomalies is 60 m and for temperature anomalies is 2C. Anomalies are
calculated from the 1981-2010 base period monthly means.
Winter Hemisphere is shown.
|