Seasonal climate forecast from CFSv2

Apr 2024 to Dec 2024  (Updated: Tue Mar 19 08:52:50 UTC 2024)

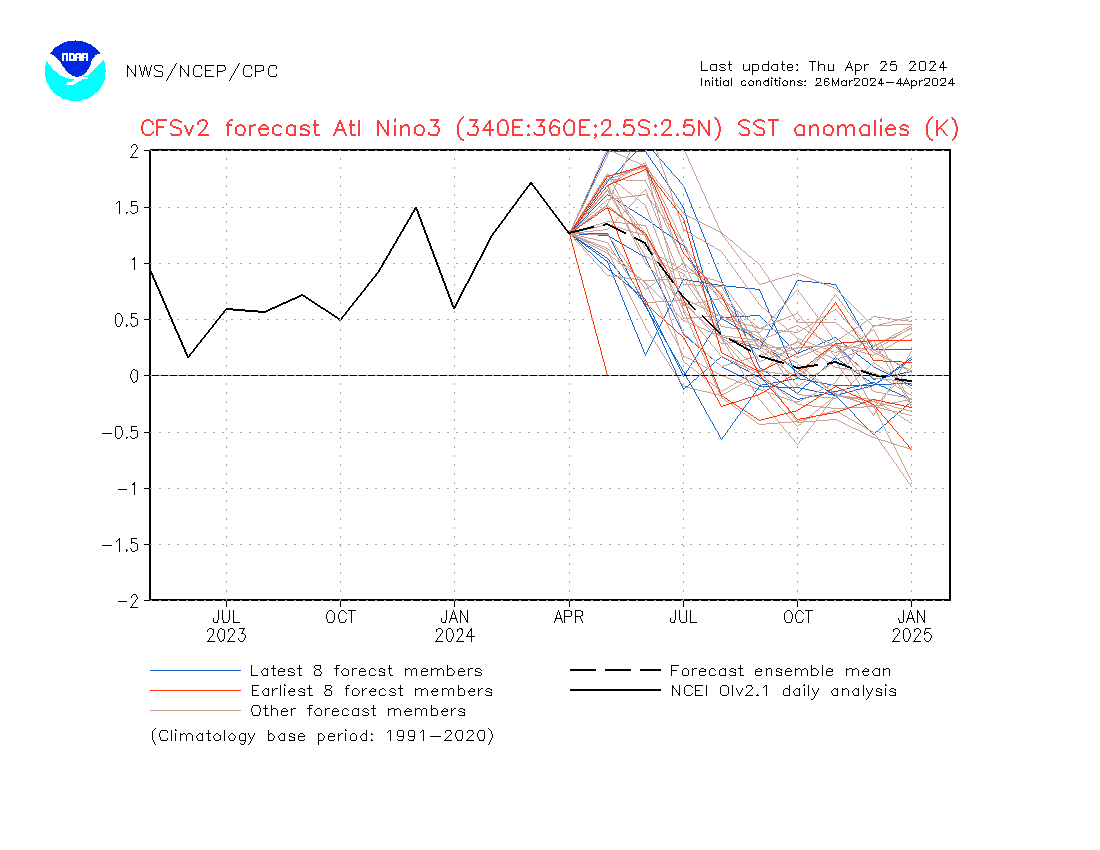
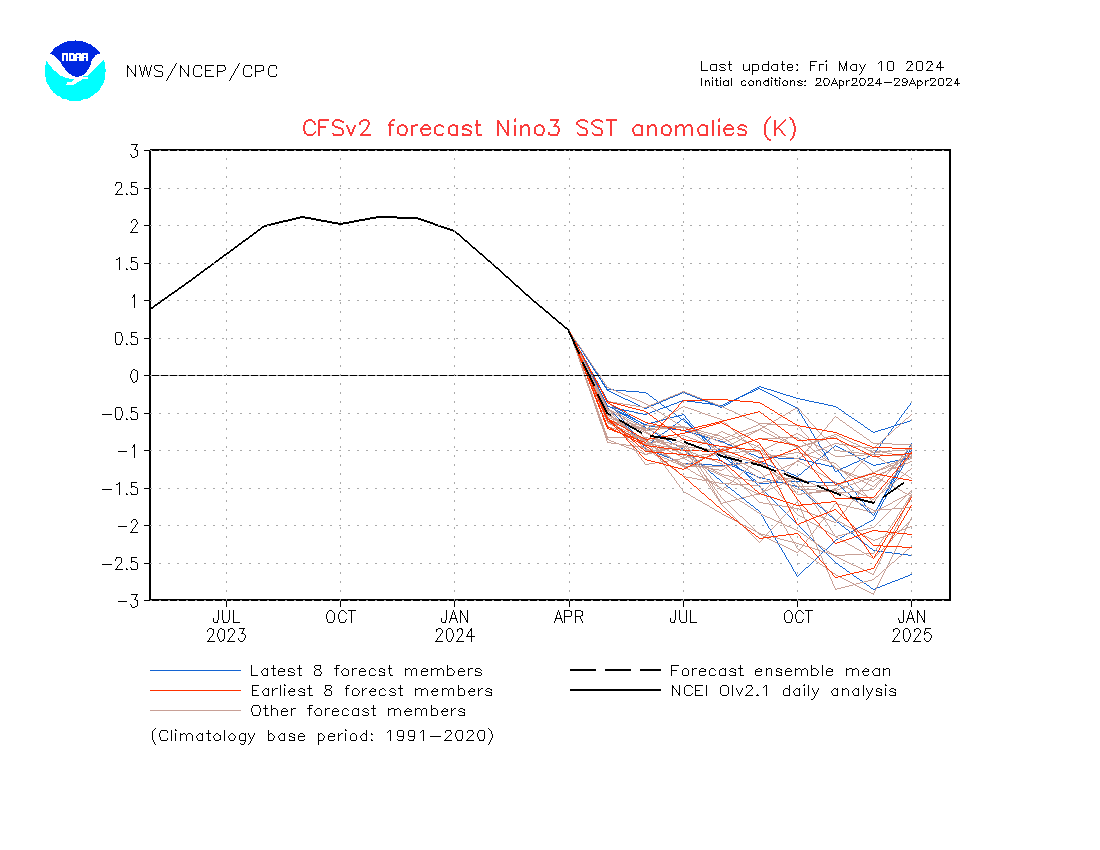
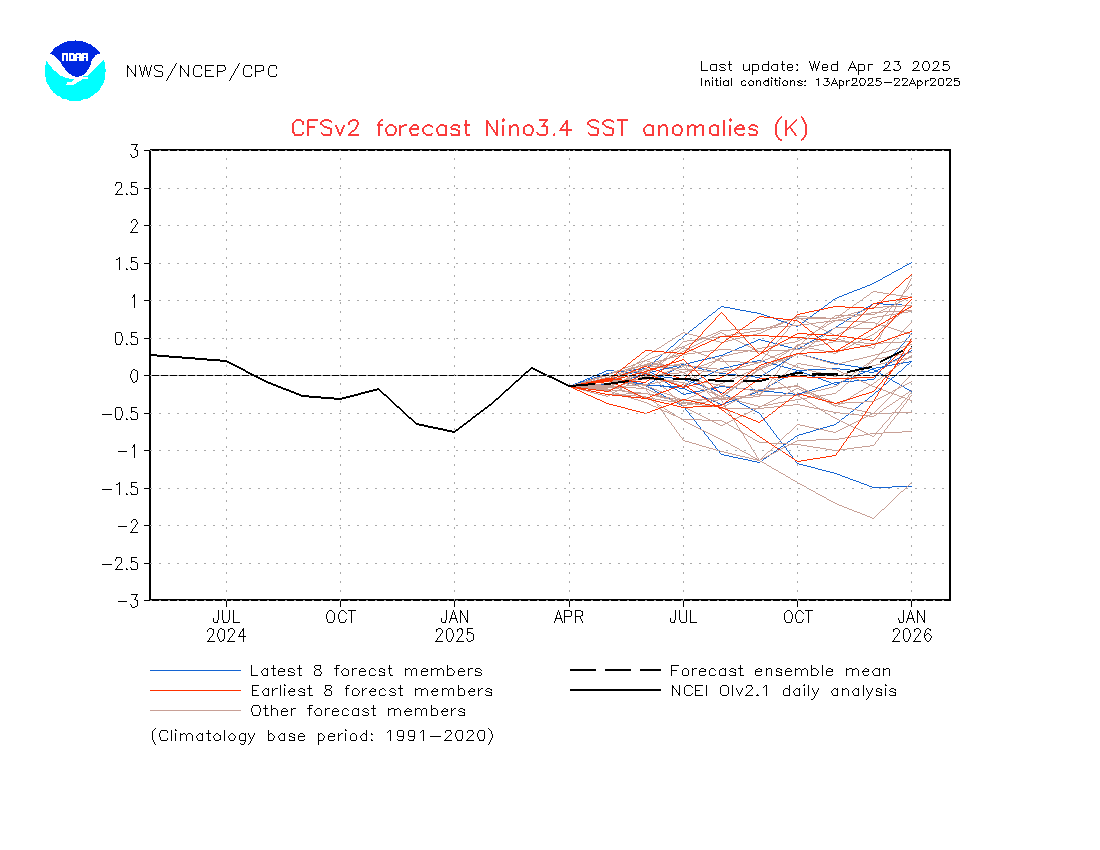
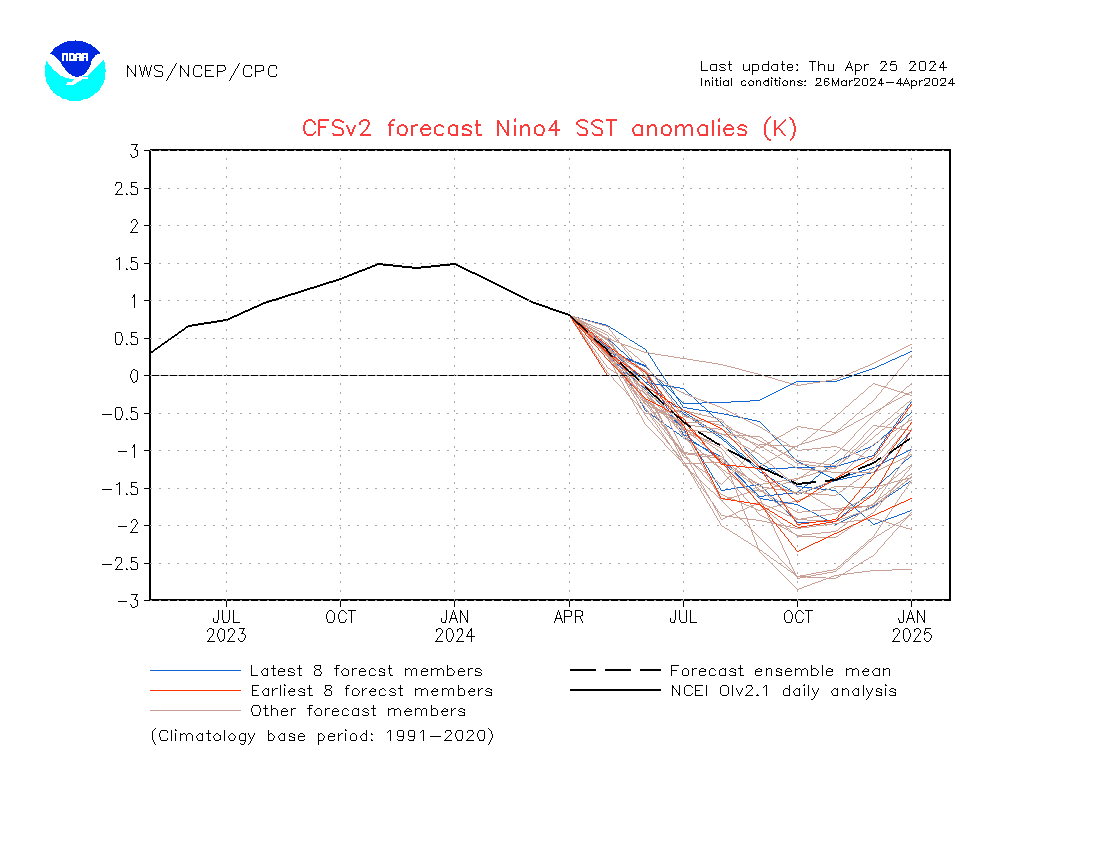
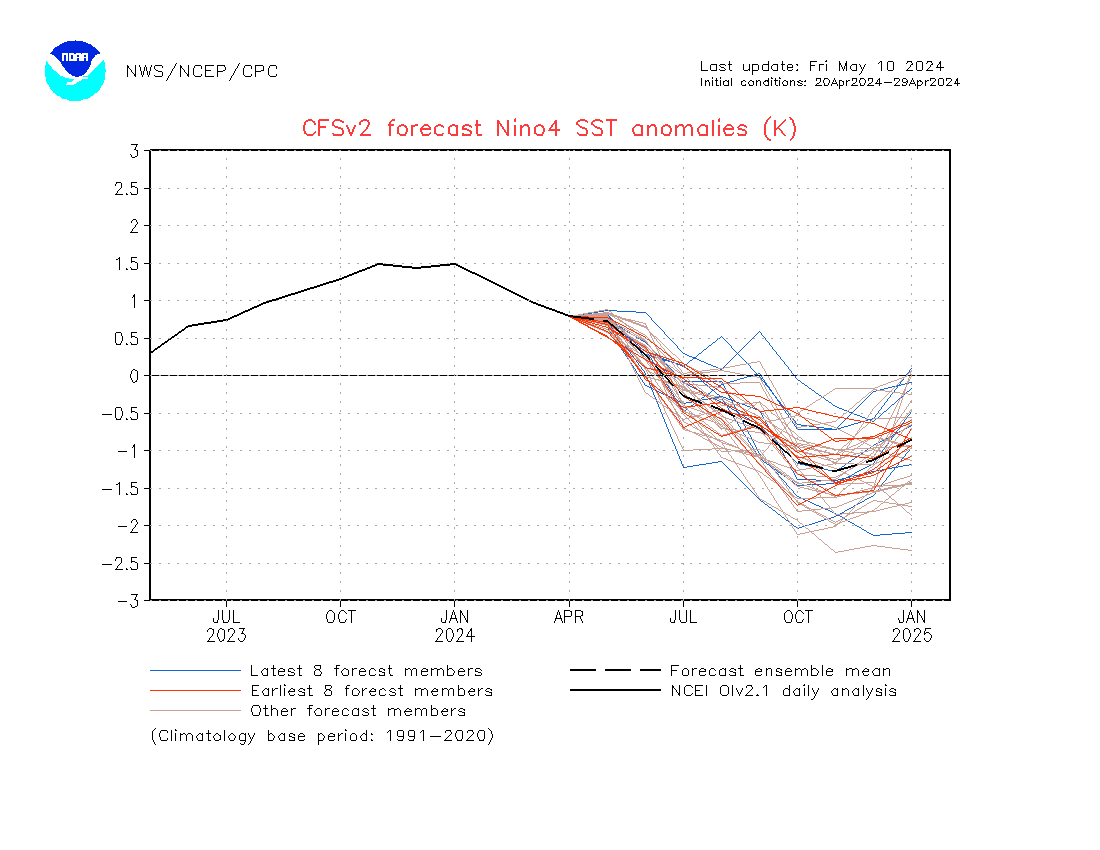
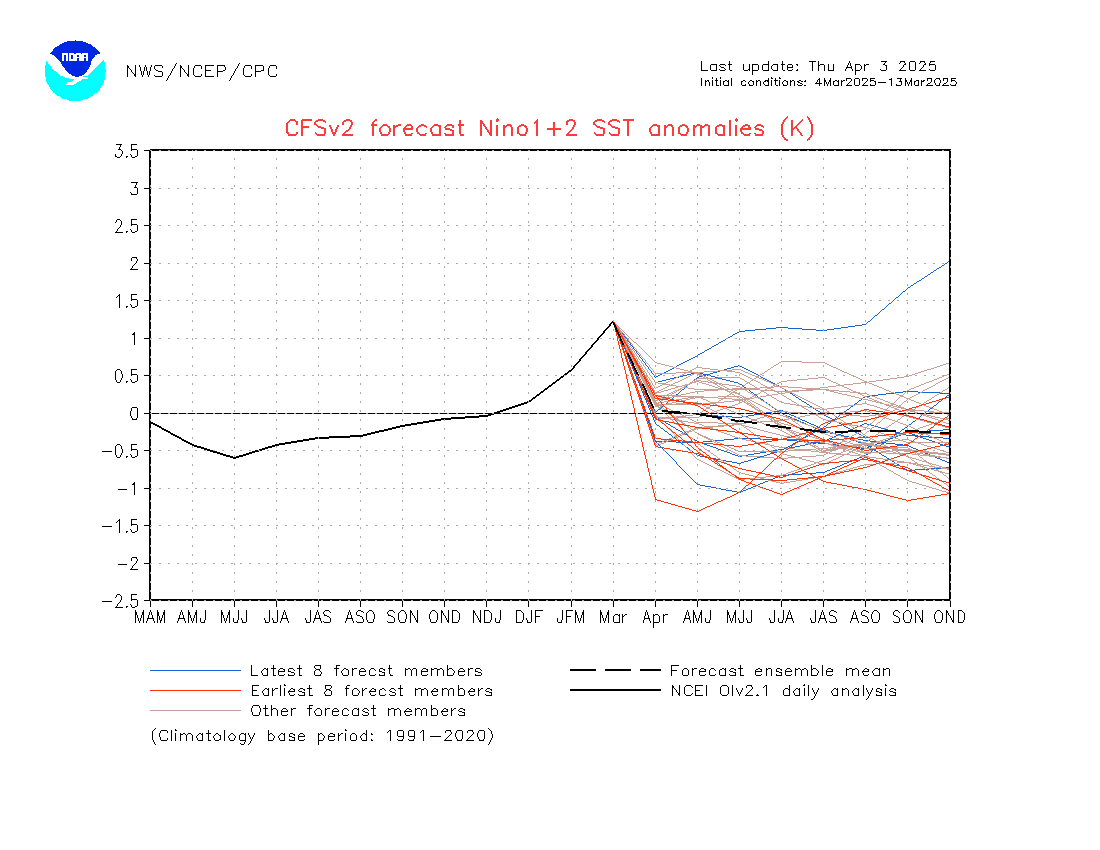
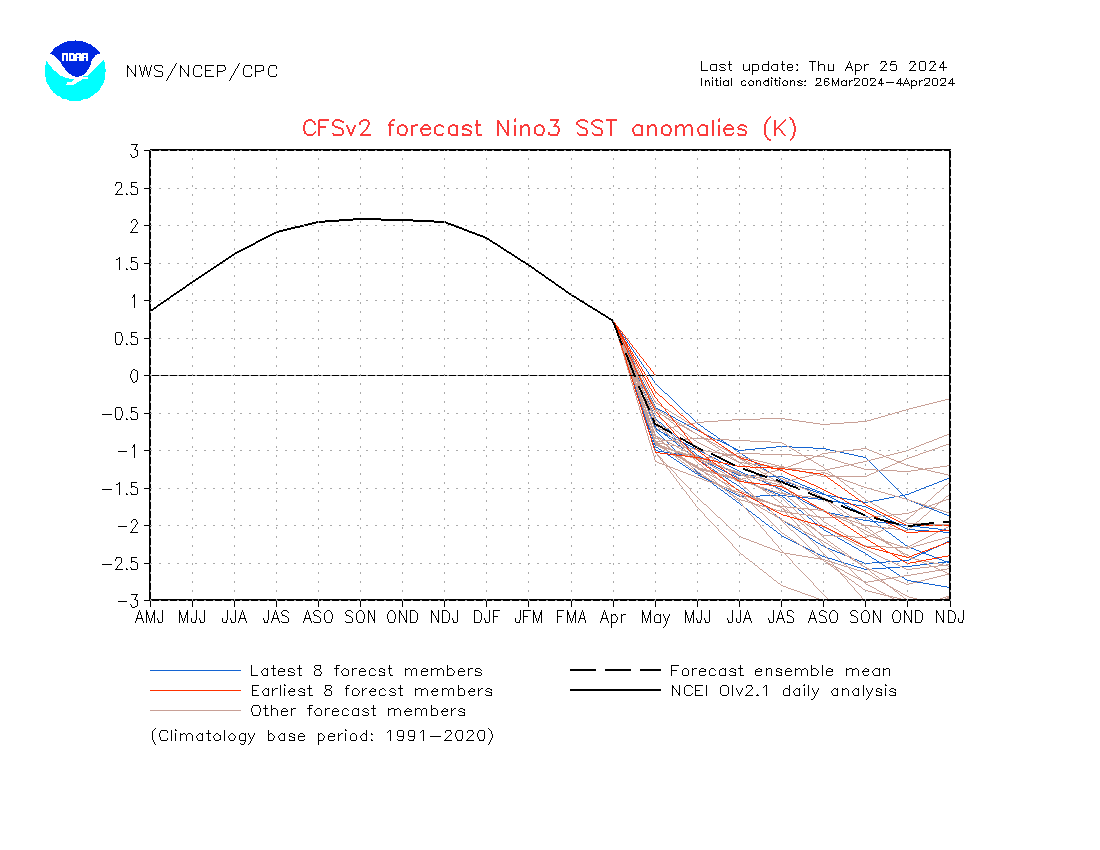
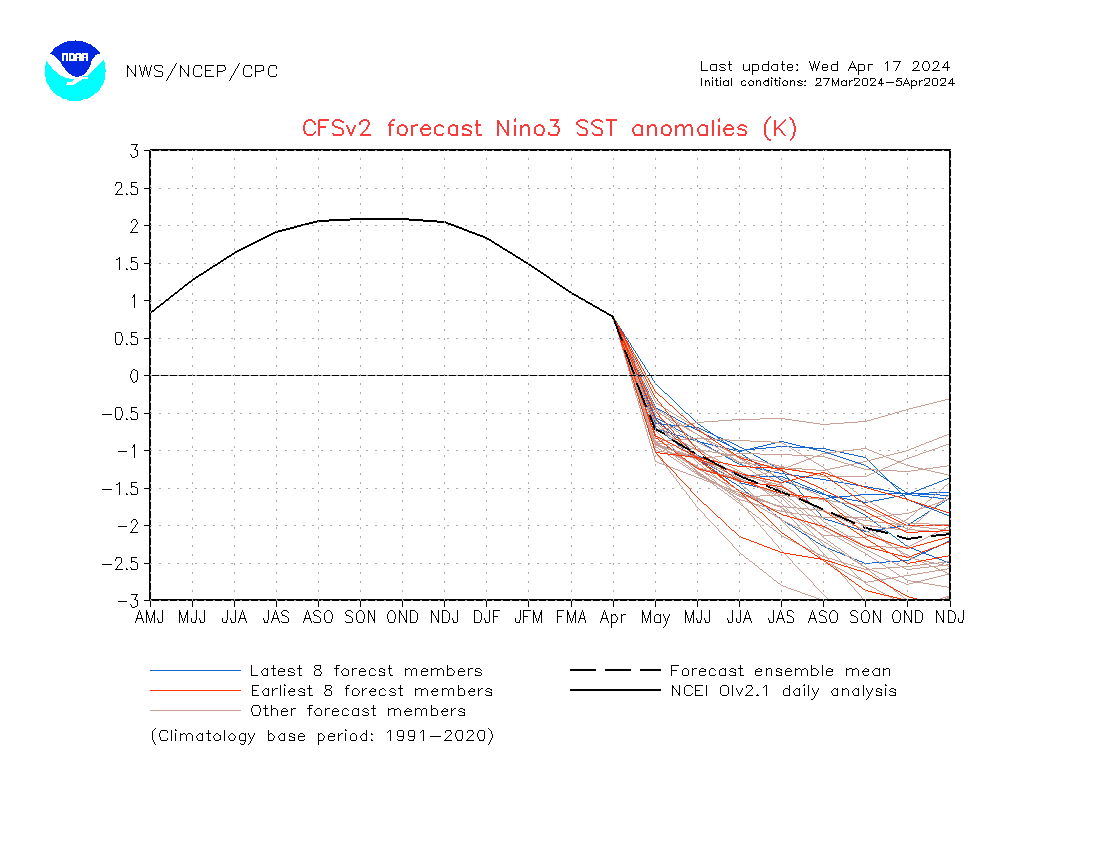
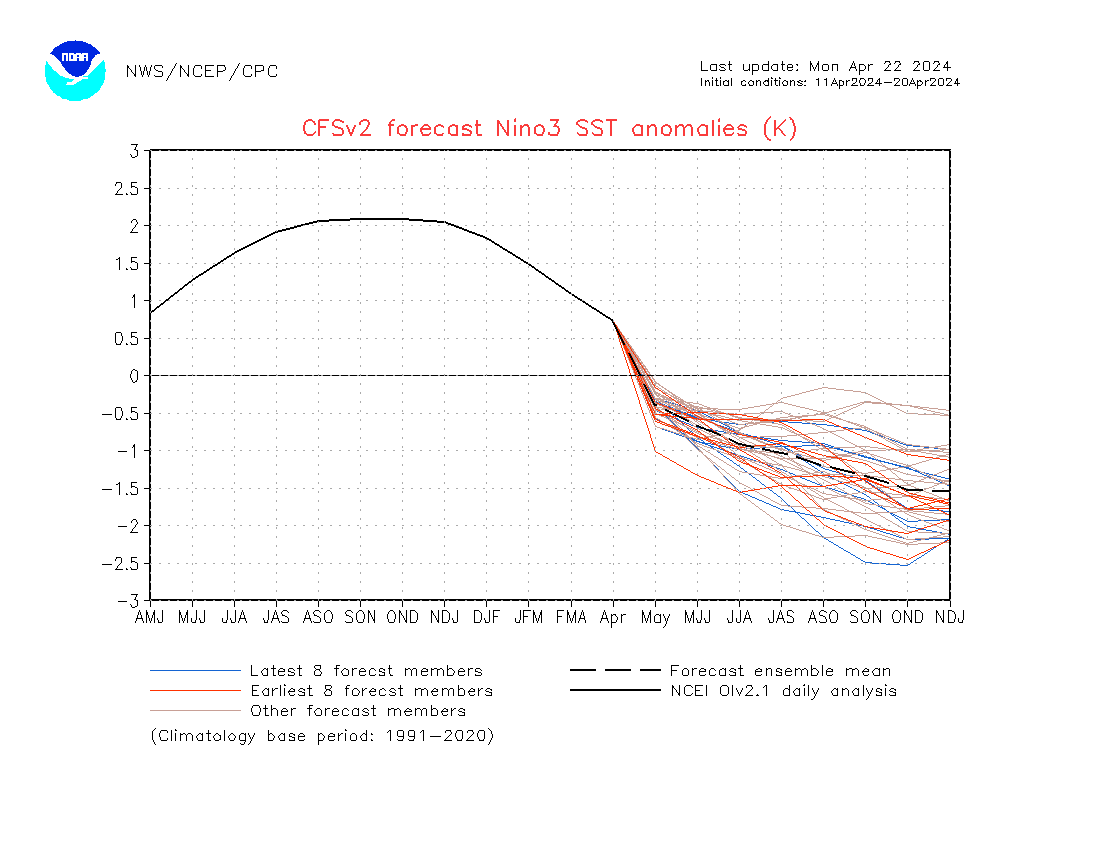
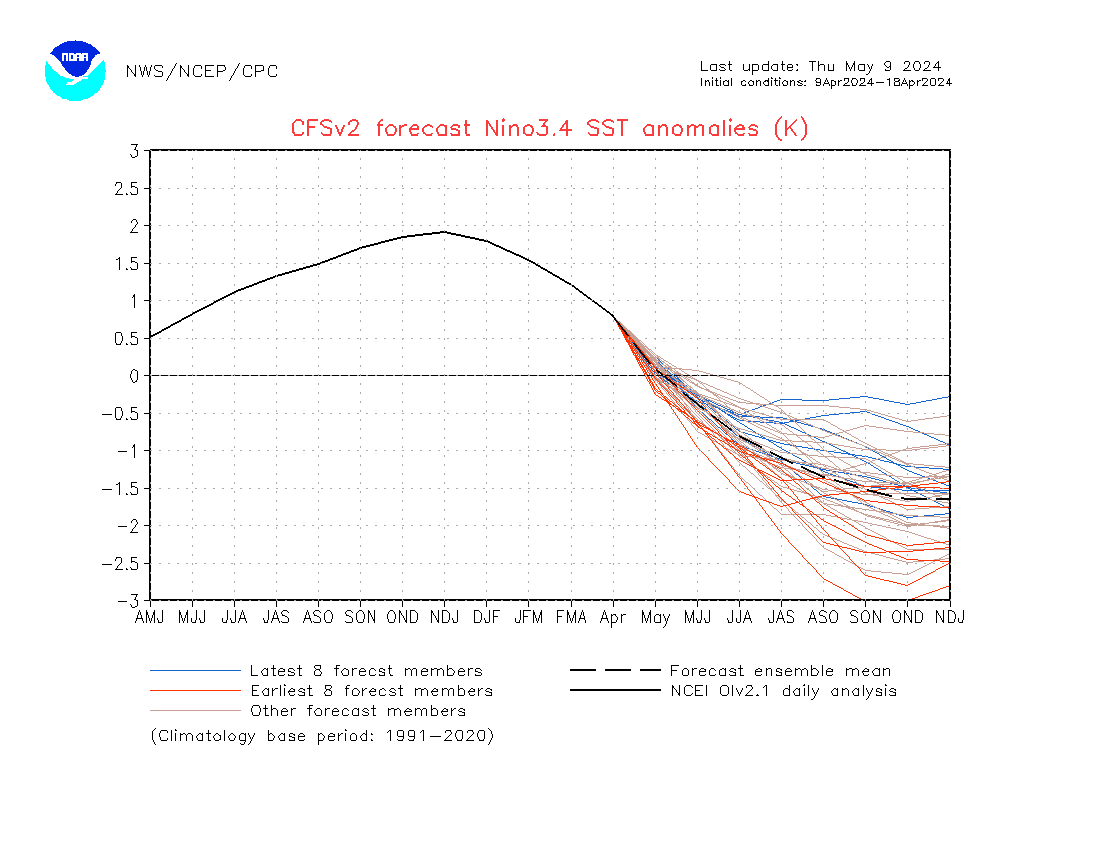
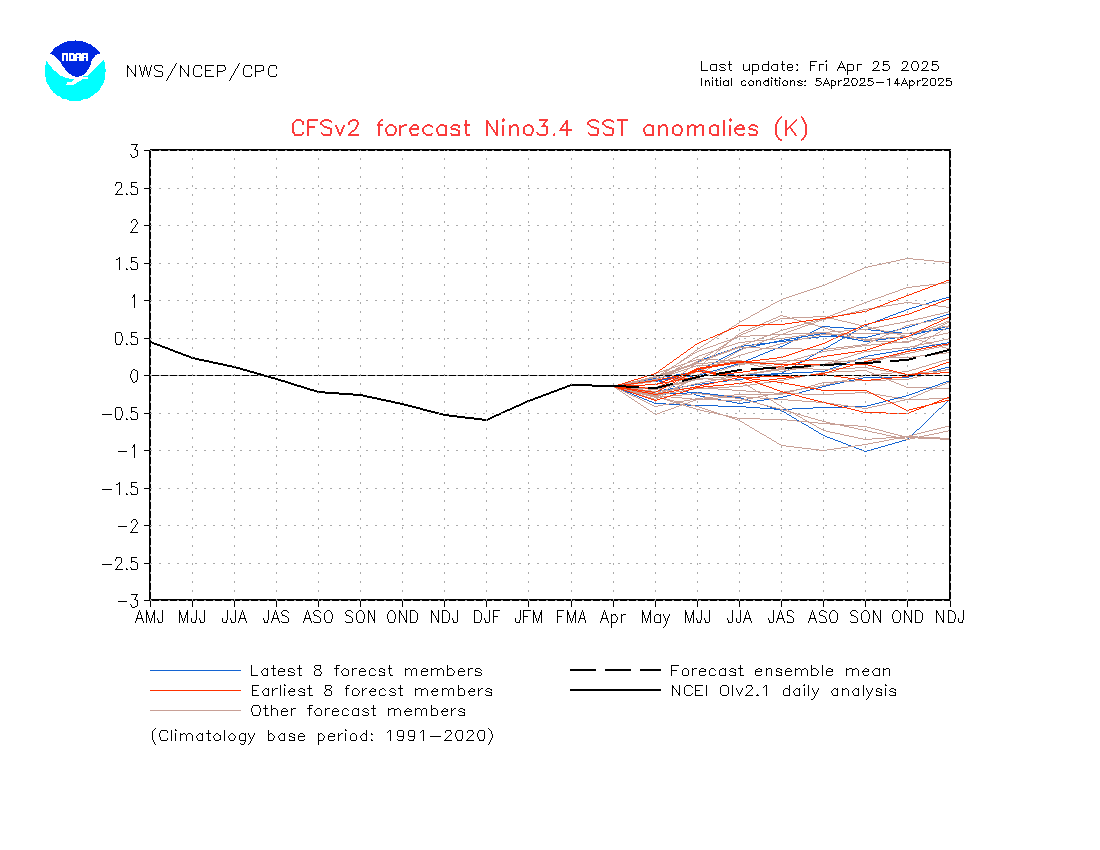
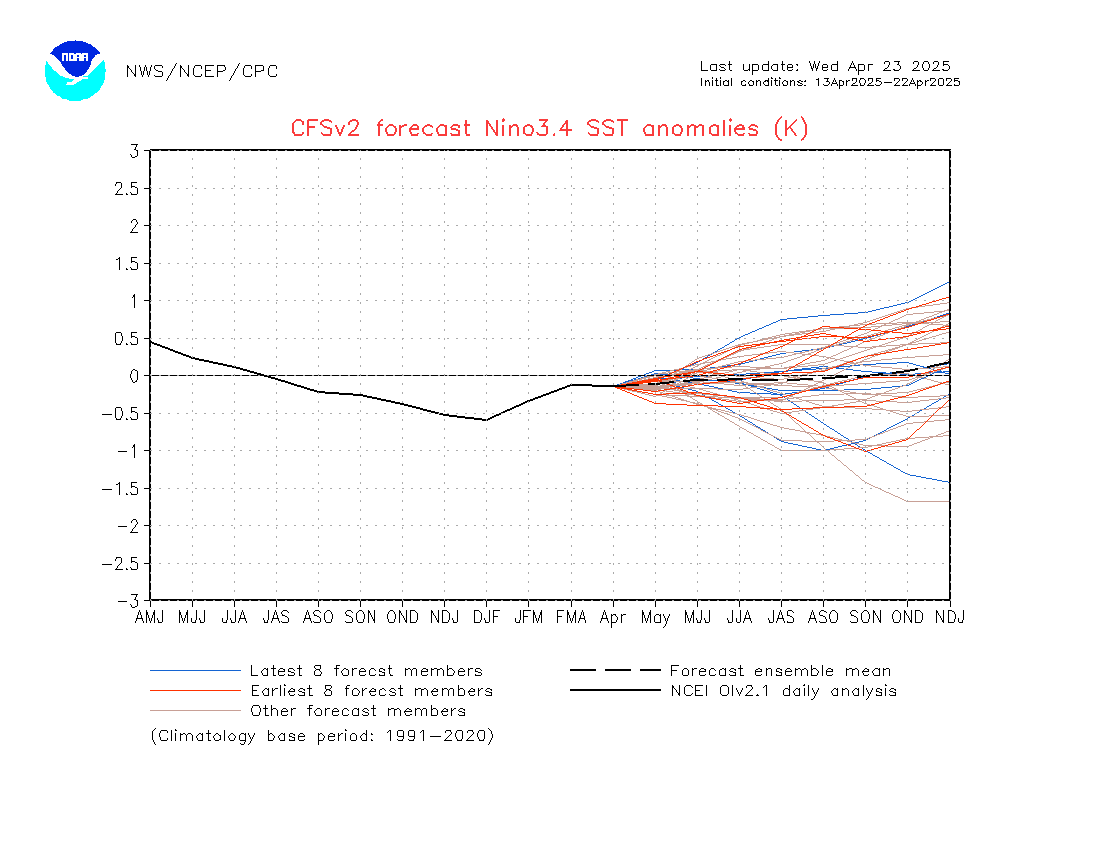
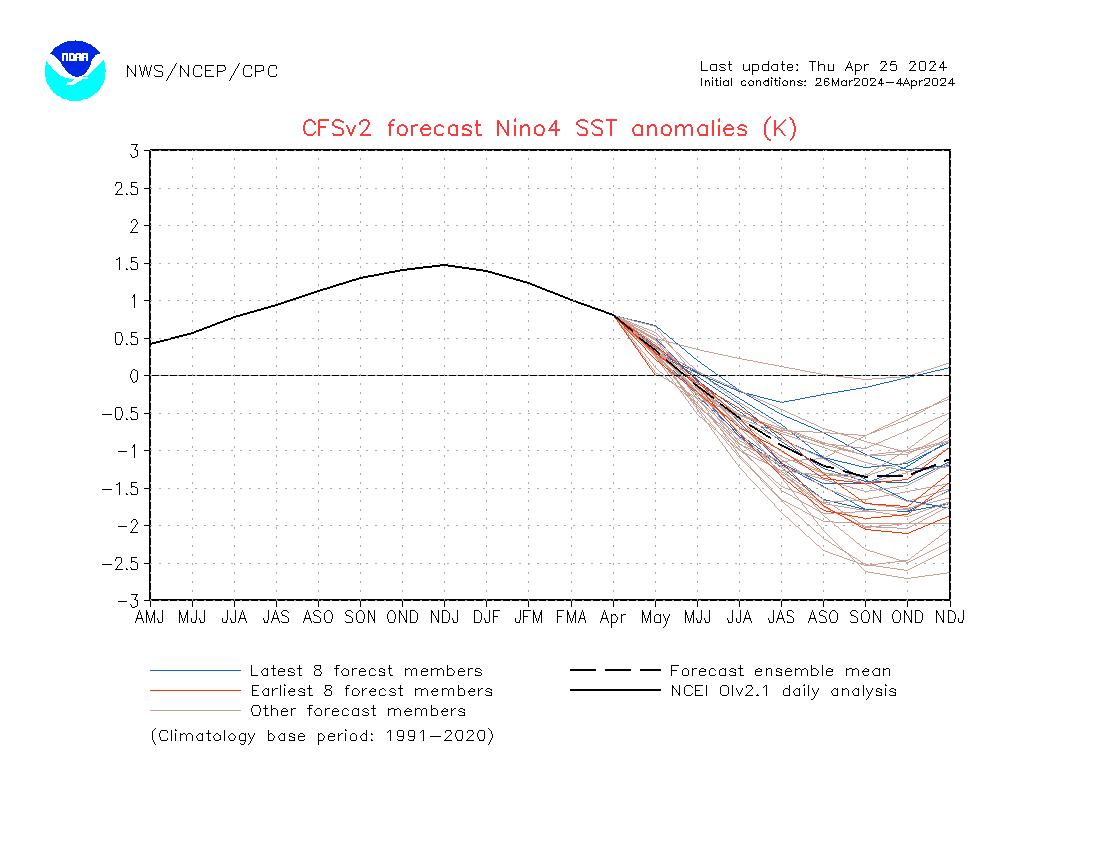
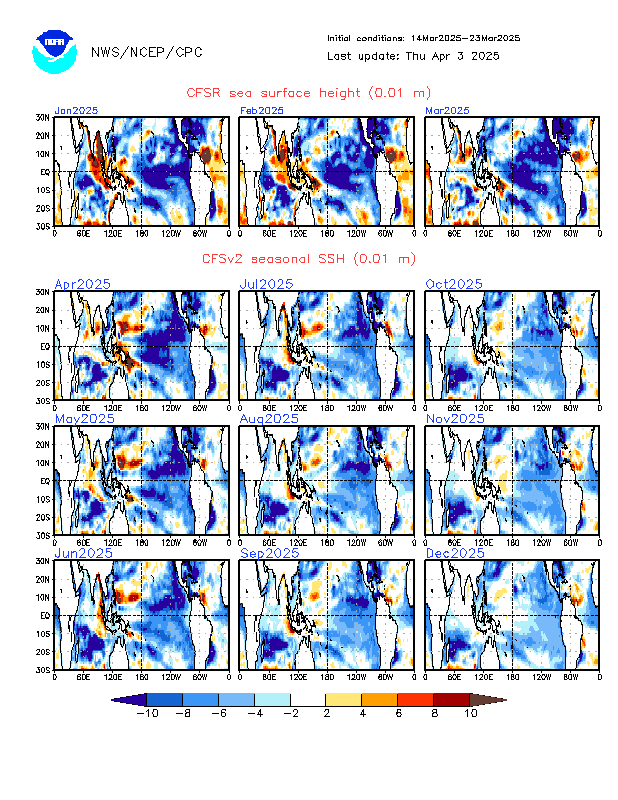
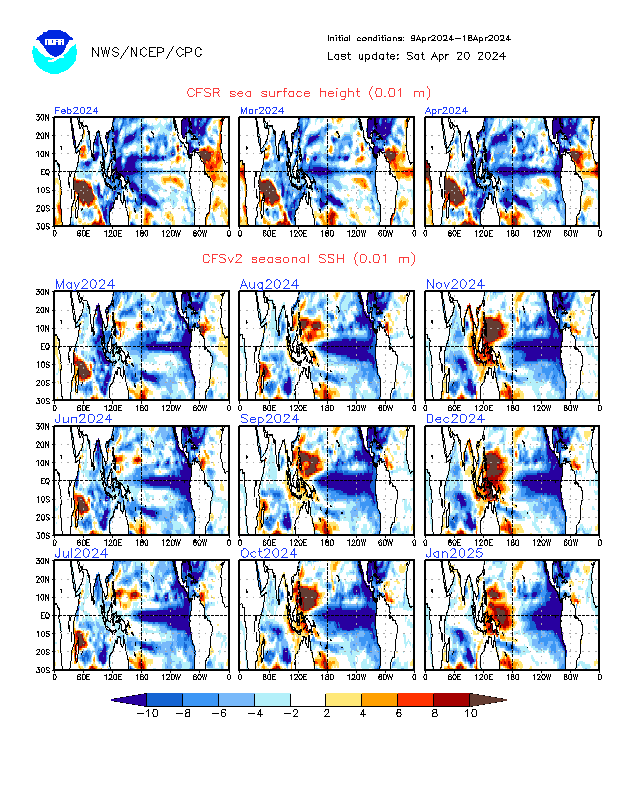
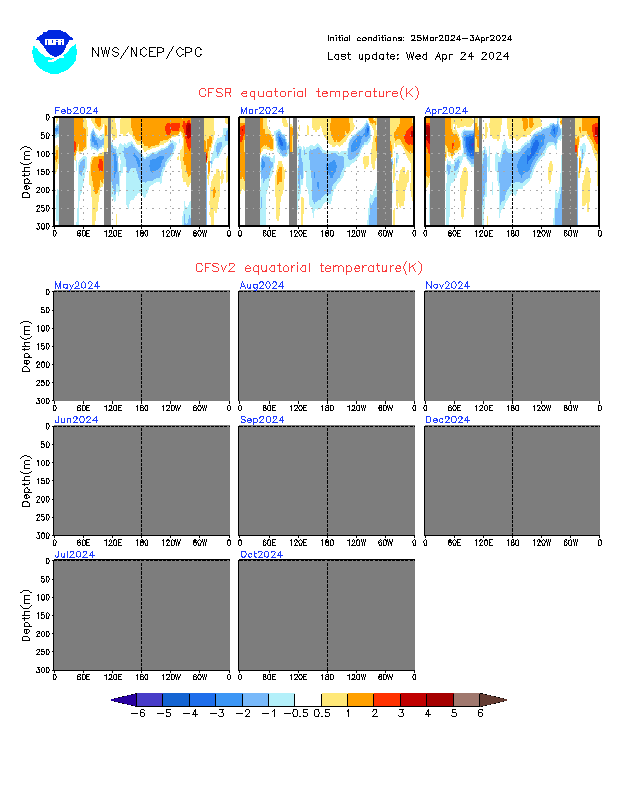
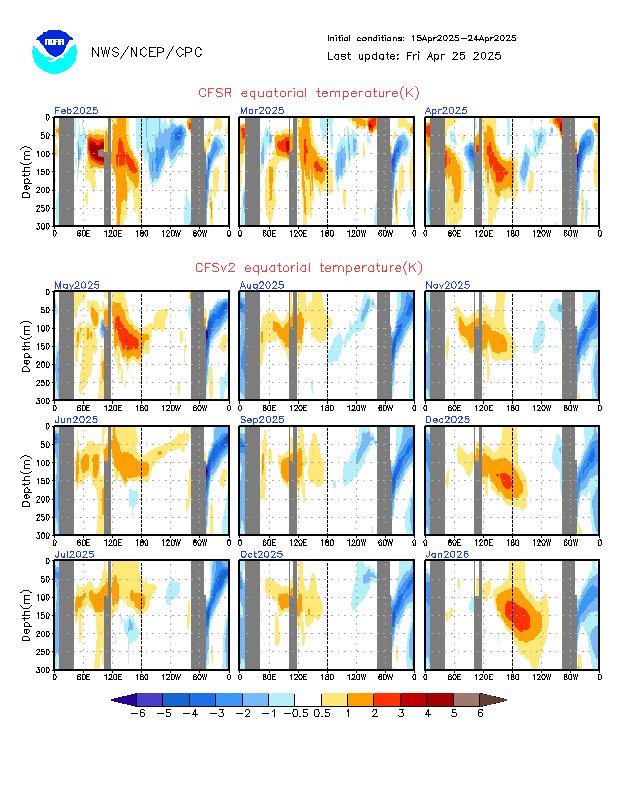
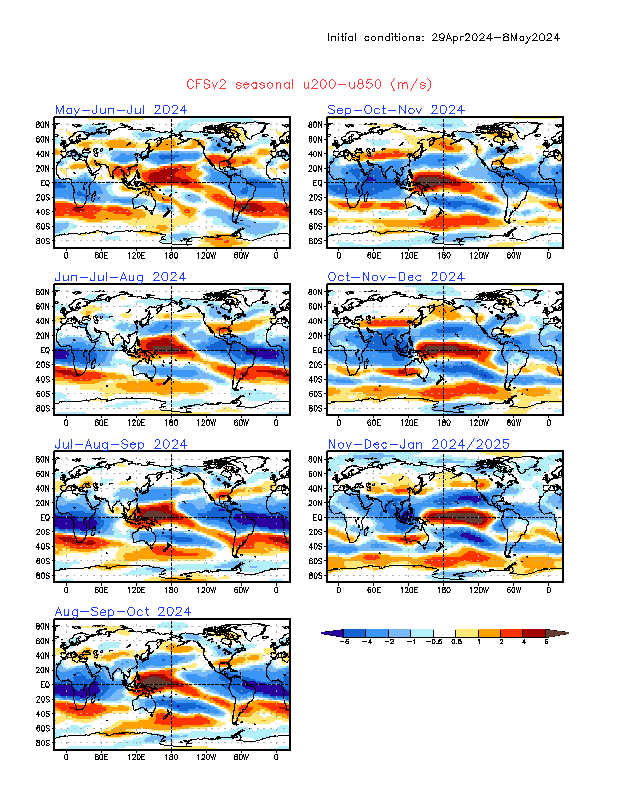
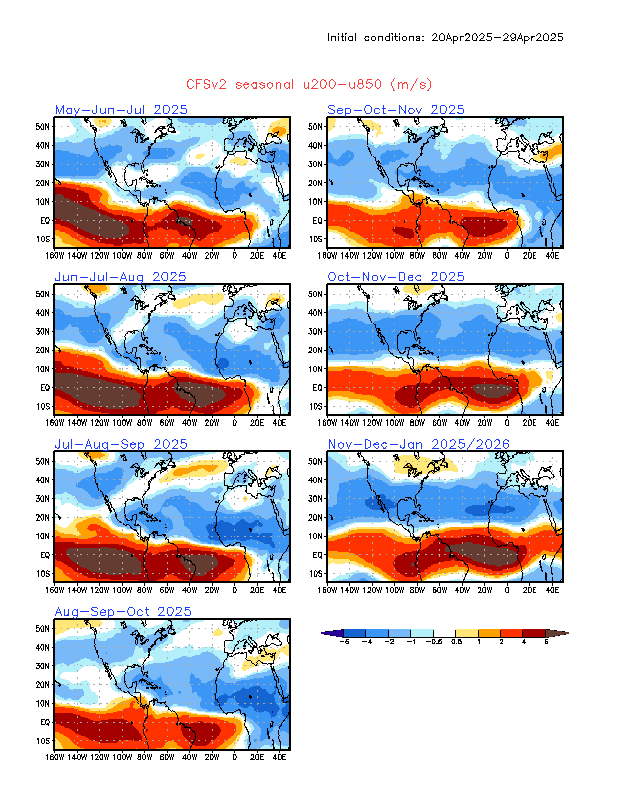
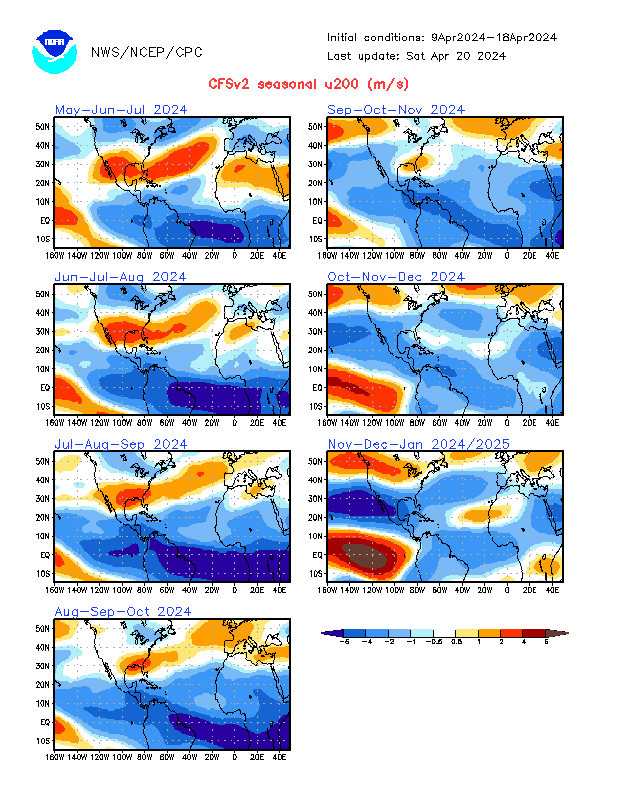
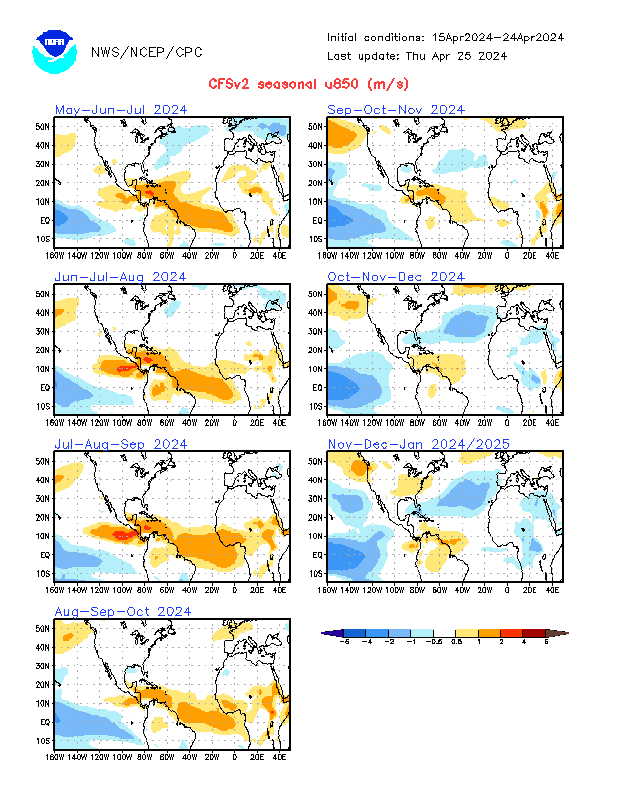
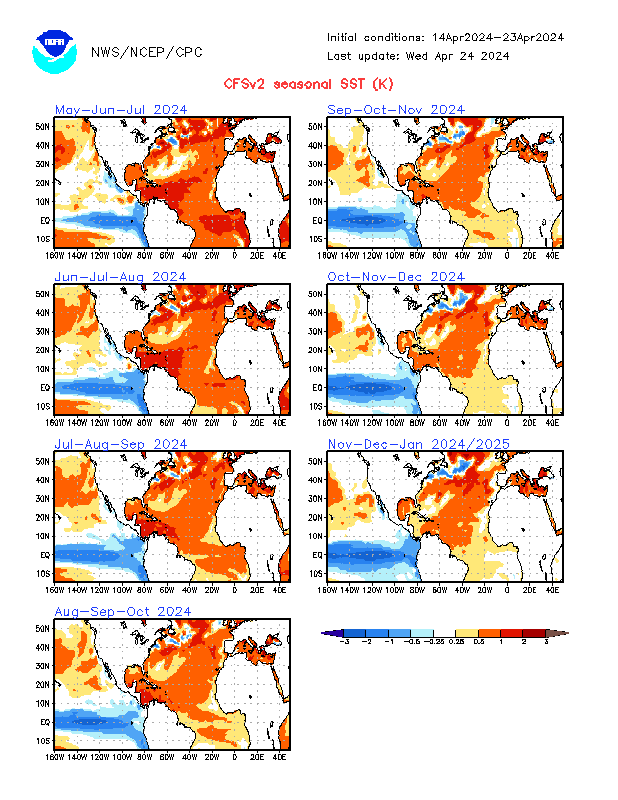
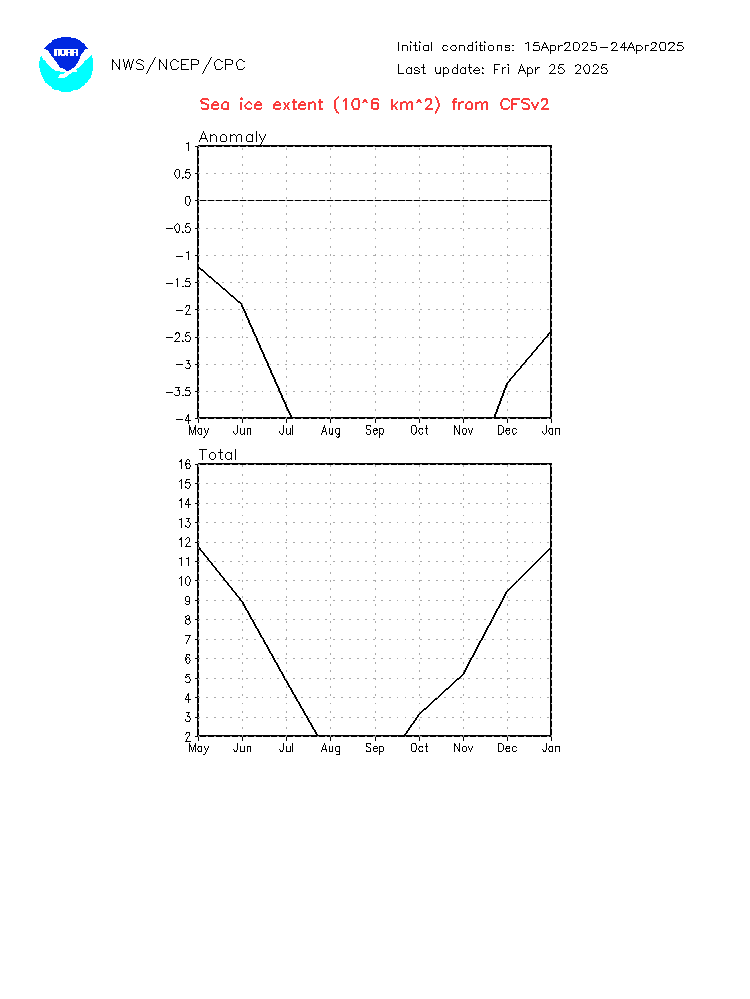
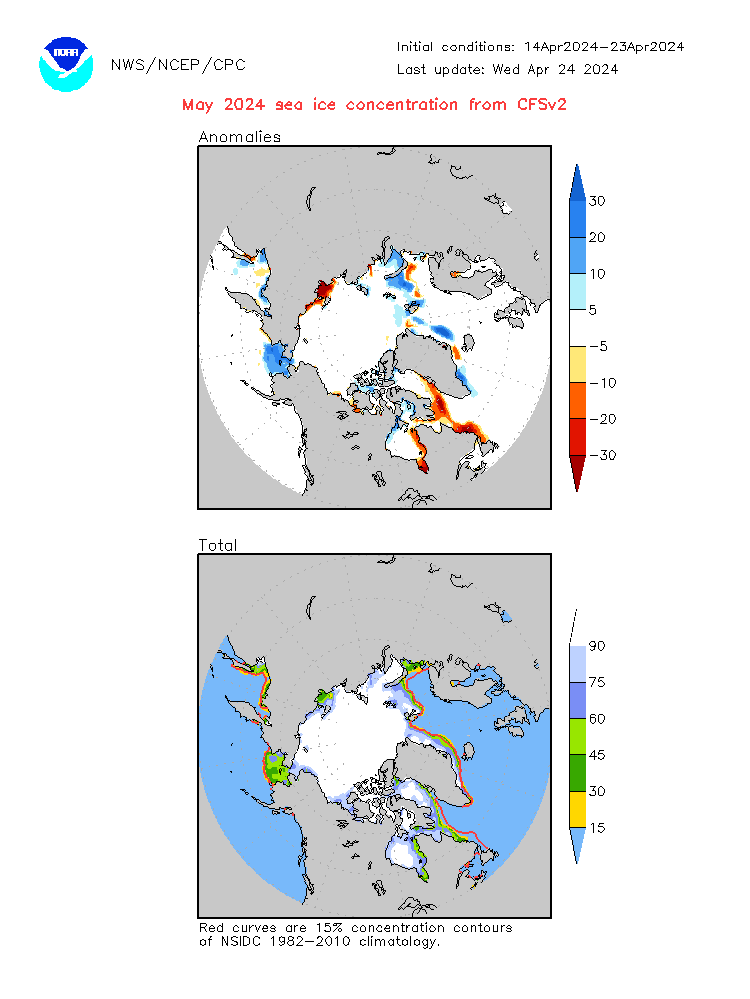
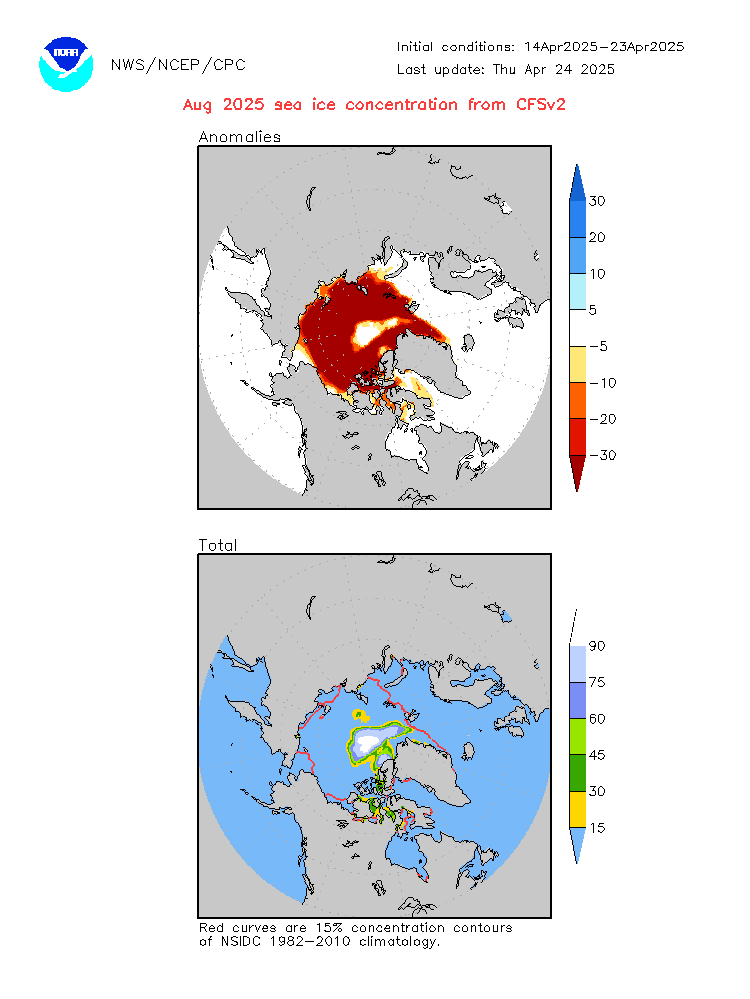
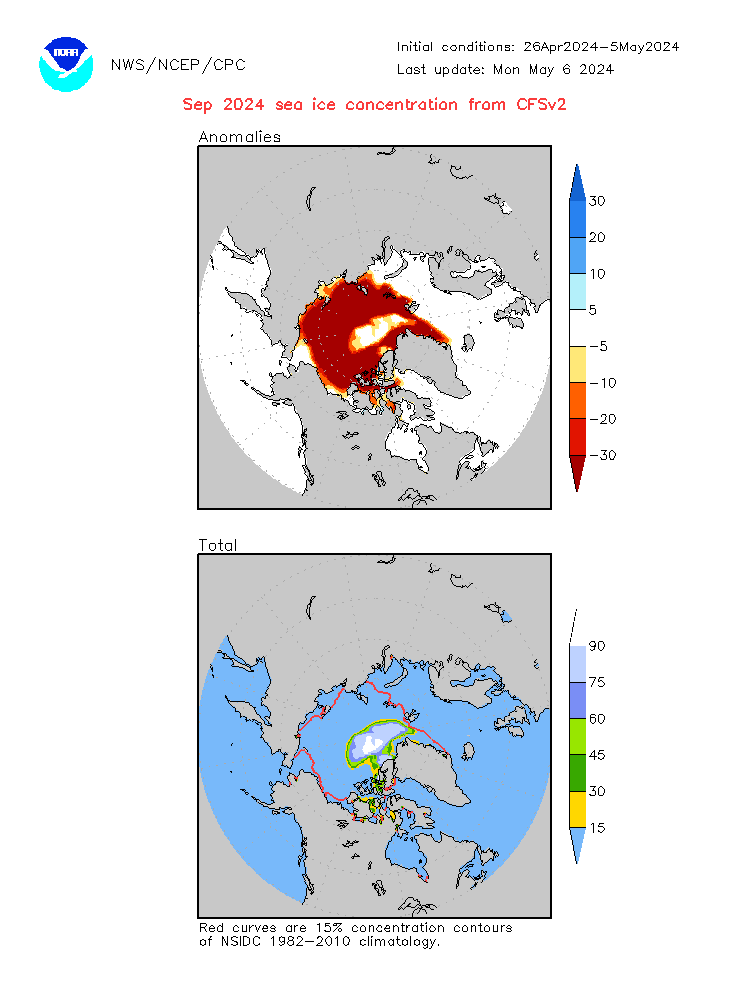
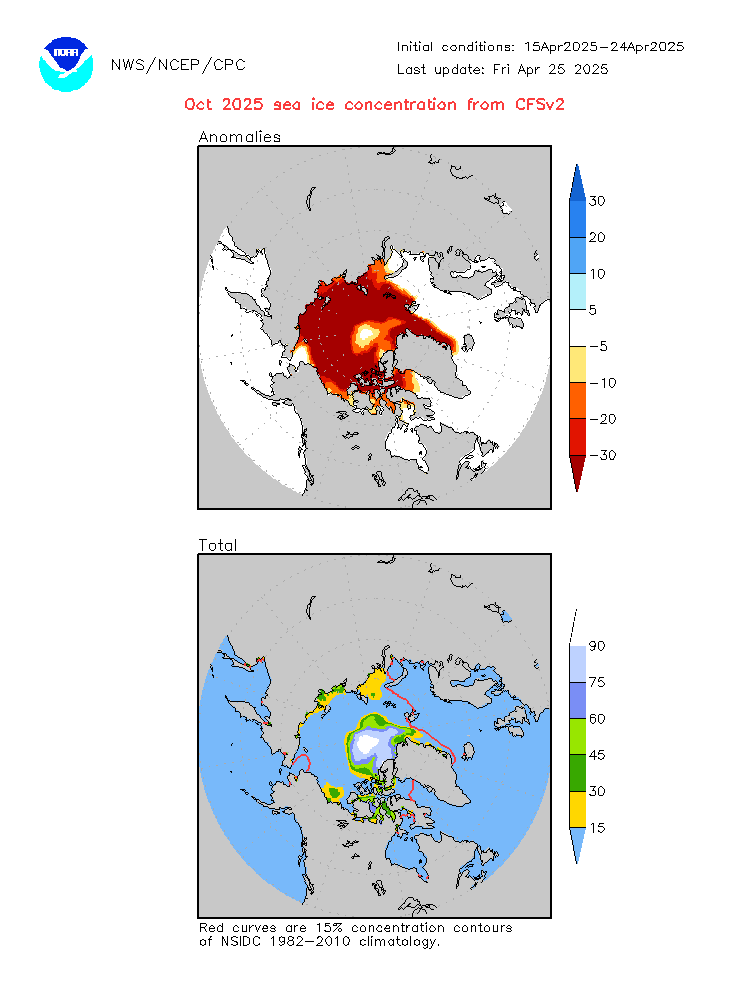
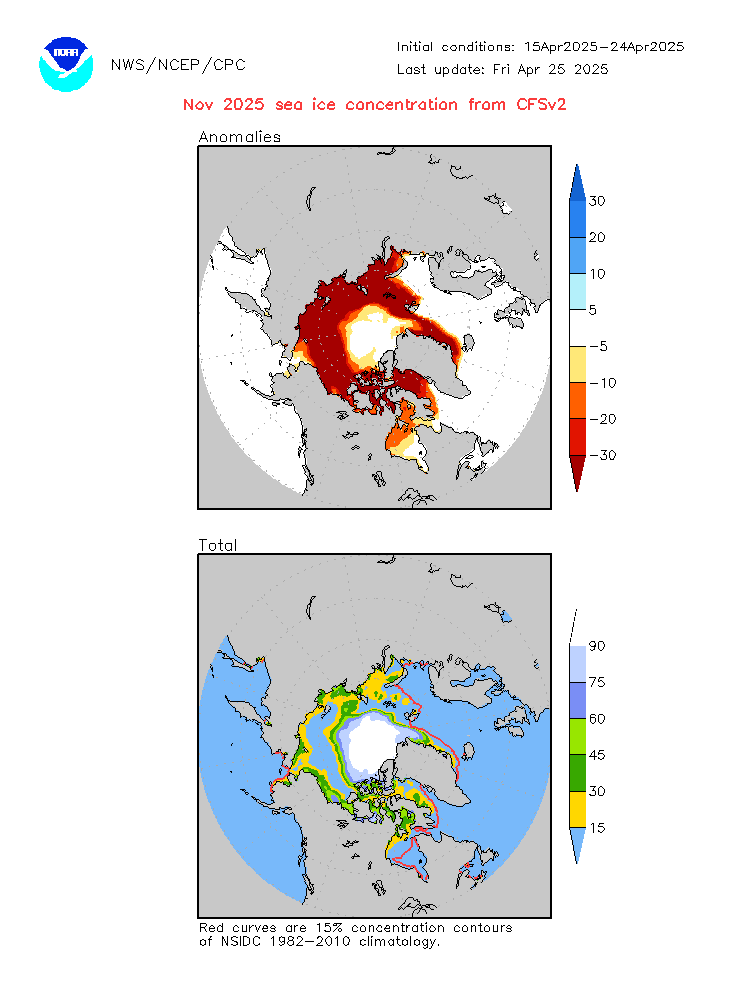
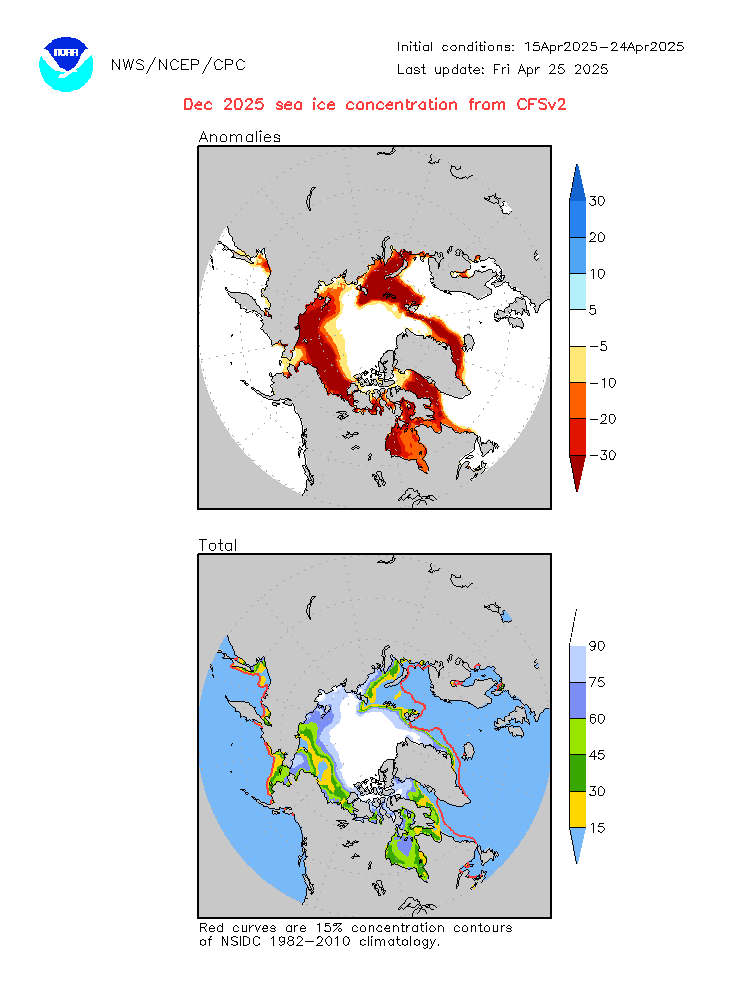
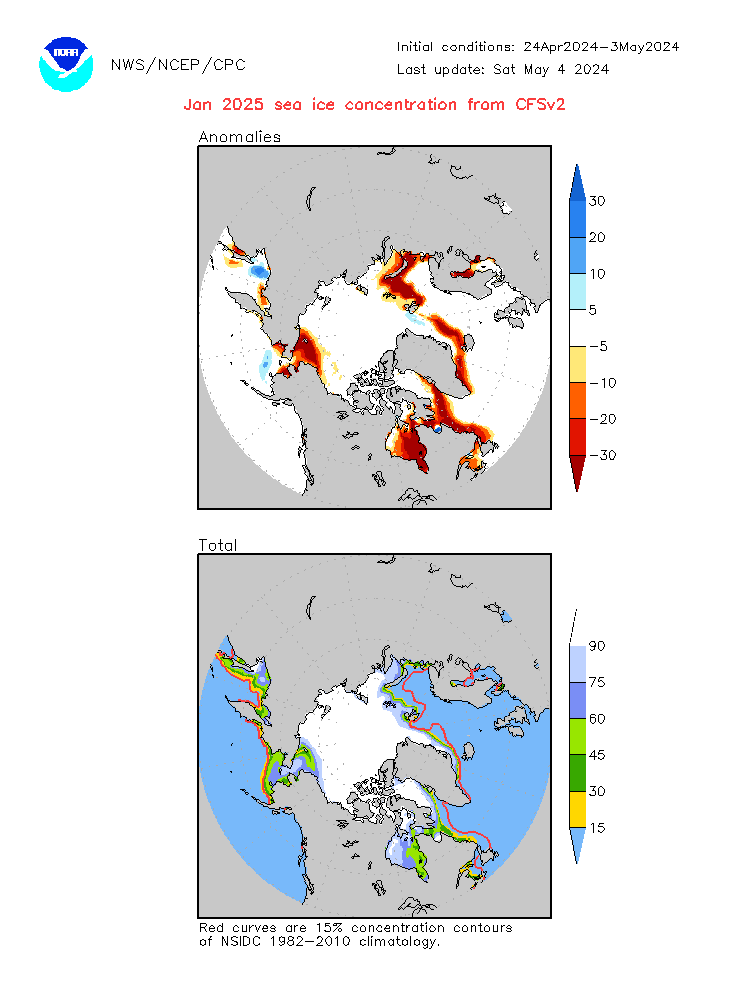
This page displays seasonal climate anomalies from the NCEP coupled forecast system 
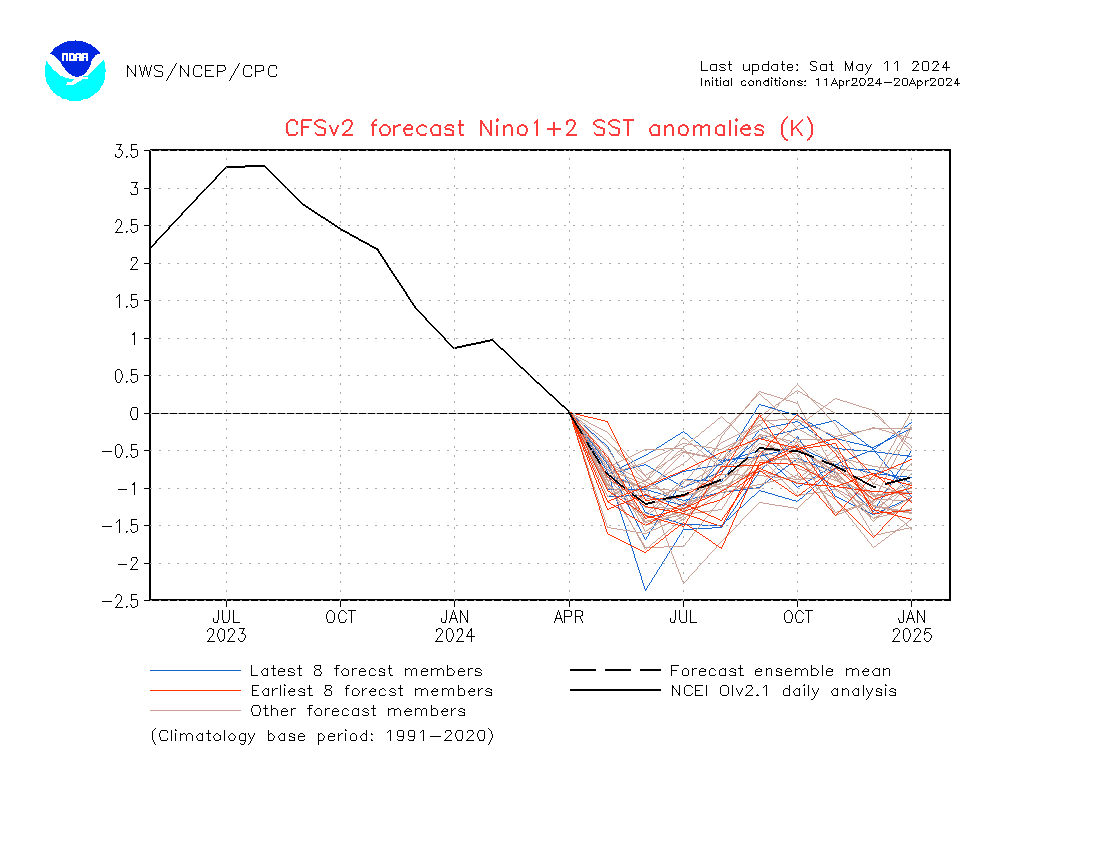
model version 2 (CFSv2). Forecasts are from initial conditions of the last 30 days, with 4 runs from each day. Forecast ensembles consist of 40 members from initial a period of 10 days. The 1st ensemble (E1) is from the earliest 10 days, the 2nd ensemble (E2) from the second earliest 10 days, and 3rd ensemble (E3) from the latest 10 days. Aomalies are with respect to 1991-2020 hindcast climatology. Temporal correlations between hindcasts and observations are used as skill mask for spatial anomalies. Standard deviation to normalize anomalies is the average standard deviation of individual hindcast members. Some additional SST plots are available here.

CAUTION: Seasonal climate anomalies shown here are not the official NCEP seasonal forecast outlooks. The NCEP seasonal forecast outlooks can be found at CPC website. Model based seasonal climate anomalies are one factor based on which NCEP seasonal forecast outlook is issued.  

Nino SSTs
Monthly
Seasonal
 Atl Nino3
 Nino1+2
 Nino3
 Nino3.4
 Nino4
 Nino1+2
 Nino3
 Nino3.4
 Nino4
E1 (data)
E2 (data)
E3 (data)
E1 (data)
E2 (data)
E3 (data)
E1 (data)
E2 (data)
E3 (data)
E1 (data)
E2 (data)
E3 (data)
E1 (data)
E2 (data)
E3 (data)
E1 (data)
E2 (data)
E3 (data)
E1 (data)
E2 (data)
E3 (data)
E1 (data)
E2 (data)
E3 (data)
E1 (data)
E2 (data)
E3 (data)

Sea surface height and equatorial temperature
 Sea surface height (x-y)
 Equatorial temperature (x-z)
E1 (data),  E2 (data),  E3 (data)

Three-month-mean spatial anomalies
Variable
Anomaly
Anomaly with skill mask
Normalized
Normalized with skill mask
SST
E1 (data),  E2 (data),  E3 (data)
E1 E2 E3
E1 E2 E3
E1 E2 E3
Prec
E1 (data),  E2 (data),  E3 (data)
E1 E2 E3
E1 E2 E3
E1 E2 E3
T2m
E1 (data),  E2 (data),  E3 (data)
E1 E2 E3
E1 E2 E3
E1 E2 E3
T850
E1 (data),  E2 (data),  E3 (data)
E1 E2 E3
E1 E2 E3
E1 E2 E3
z200
E1 (data),  E2 (data),  E3 (data)
E1 E2 E3
E1 E2 E3
E1 E2 E3
z700
E1 (data),  E2 (data),  E3 (data)
E1 E2 E3
E1 E2 E3
E1 E2 E3
NA Prec
E1 (data),  E2 (data),  E3 (data)
E1 E2 E3
E1 E2 E3
E1 E2 E3
NA T2m
E1 (data),  E2 (data),  E3 (data)
E1 E2 E3
E1 E2 E3
E1 E2 E3
NA T850
E1 (data),  E2 (data),  E3 (data)
E1 E2 E3
E1 E2 E3
E1 E2 E3
NA SM
E1 (data),  E2 (data),  E3 (data)
E1 E2 E3
E1 E2 E3
E1 E2 E3
Arctic T2m
E1 (data),  E2 (data),  E3 (data)
E1 E2 E3
E1 E2 E3
E1 E2 E3
Europe Prec
E1 (data),  E2 (data),  E3 (data)
E1 E2 E3
E1 E2 E3
E1 E2 E3
Europe T2m
E1 (data),  E2 (data),  E3 (data)
E1 E2 E3
E1 E2 E3
E1 E2 E3
Misc (E3)
Global u200-u850   Atlantic u200-u850   Atlantic u200   Atlantic u850   Atlantic SST  

Monthly-mean spatial anomalies
Variable
Anomaly
Anomaly with skill mask
Normalized
Normalized with skill mask
SST
E1 (data),  E2 (data),  E3 (data)
E1 E2 E3
E1 E2 E3
E1 E2 E3
Prec
E1 (data),  E2 (data),  E3 (data)
E1 E2 E3
E1 E2 E3
E1 E2 E3
T2m
E1 (data),  E2 (data),  E3 (data)
E1 E2 E3
E1 E2 E3
E1 E2 E3
T850
E1 (data),  E2 (data),  E3 (data)
E1 E2 E3
E1 E2 E3
E1 E2 E3
z200
E1 (data),  E2 (data),  E3 (data)
E1 E2 E3
E1 E2 E3
E1 E2 E3
z700
E1 (data),  E2 (data),  E3 (data)
E1 E2 E3
E1 E2 E3
E1 E2 E3
NA Prec
E1 (data),  E2 (data),  E3 (data)
E1 E2 E3
E1 E2 E3
E1 E2 E3
NA T2m
E1 (data),  E2 (data),  E3 (data)
E1 E2 E3
E1 E2 E3
E1 E2 E3
NA T850
E1 (data),  E2 (data),  E3 (data)
E1 E2 E3
E1 E2 E3
E1 E2 E3
NA SM
E1 (data),  E2 (data),  E3 (data)
E1 E2 E3
E1 E2 E3
E1 E2 E3
Arctic T2m
E1 (data),  E2 (data),  E3 (data)
E1 E2 E3
E1 E2 E3
E1 E2 E3
Europe Prec
E1 (data),  E2 (data),  E3 (data)
E1 E2 E3
E1 E2 E3
E1 E2 E3
Europe T2m
E1 (data),  E2 (data),  E3 (data)
E1 E2 E3
E1 E2 E3
E1 E2 E3

Sea ice extent and concentration
Extent
Concentration
Anom&Total
L0 L1 L2 L3 L4 L5 L6 L7 L8

CFSv2-related links
Monthly forecast
Weekly forecast
Hindcast diagnoses
Forecasts from previous months
Forecast Assessment
CFS Home

Send your comments to: Wanqiu Wang   and  Mingyue Chen